

An in vitro evaluation of the efficacy of Agomelatine in combination with Thapsigargin and 2-Aminoethoxydiphenyl borate for the treatment of type 2 diabetes
- Department of Biotechnology, Noida Institute of Engineering Technology, 19, Knowledge Park- II, Institutional Area, Greater Noida (UP) – 201306, India
- School of Biotechnology, Rajiv Gandhi Proudyogiki Vishwavidyalaya, Bhopal (M.P)- 462033, India
Abstract
Background: Type 2 diabetes is a heterogeneous disorder characterized by defective insulin secretion and insulin sensitivity. Ca2+ mobilization regulates pancreatic β-cell synthesis, storage, and release of insulin in response to variations in circulating metabolite levels and intracellular glucose metabolism. Pineal gland melatonin synthesis regulates carbohydrate metabolism; melatonin is referred to as the “hormone of darkness,” and sleep deprivation is one of the risk factors for diabetes.
Methods: Melatonin receptor types 1A and 1B are two G-protein coupled receptors that mediate melatonin's function. The effect of agomelatine (a melatonin agonist) in combination with thapsigargin and 2-Aminoethoxydiphenyl borate (2-APB) on MIN 6 cells was investigated through dose-effect curves for each drug. The PLC/IP3 pathway via melatonin receptors on pancreatic β-cells was targeted.
Results: The three drugs and their combination exposure treatments were statistically analyzed for significant differences using one-way ANOVA. Dunnett's test was used to compare the different treatment groups. Mean insulin secretion responses were found to not be equal across groups, thus treatments had different effects on cells’ insulin regulation. The method of combination index (CI) predicted synergism in agomelatine and 2-APB, which may have therapeutic implications for diabetes.
Conclusion: As melatonin regulates circadian rhythm, incorporation of a melatonin agonist like agomelatine along with 2-APB may maintain both sleep/wake cycle conditions and insulin secretion by pancreatic cells. This combination of drugs may be a promising agent in the treatment of symptoms of depression and anxiety and thus the improvement of health-related behaviors in depressed patients with Type 2 diabetes.
Introduction
Type 2 diabetes is a chronic disease that occurs when the pancreas is either no longer able to synthesize insulin, or the body cannot utilize the insulin that it produces. The development of type 2 diabetes is influenced by a variety of factors. The most important is the lifestyle choices that are often connected with urbanization. Pineal gland melatonin secretion regulates carbohydrate metabolism 1, 2. The effects of melatonin on glucose metabolism have been shown in both humans3 and rodents4, but the exact mechanism is still unexplored. It is thought that melatonin acts directly on pancreatic β-cells, which are known to contain melatonin-binding elements5, 6. Some researchers believe that melatonin's effect on pancreatic cells and insulin release is linked to a complex network of intracellular signalling networks, including the cAMP, cGMP, and IP3 signalling pathways7.
Diabetes is a human and economic burden as it causes 4.2 million deaths per year and accounts for 10 percent of worldwide healthcare expenditures. In 2019, India, China, and the United States of America had the highest number of diabetic adults and this is estimated to persist until 2030 (www.idf.org). Diabetic patients have lower elevations in nighttime melatonin levels, suggesting a possible relationship between melatonin and the hyperglycemic/diabetic condition7. Diabetes mellitus has also been linked to sleep deprivation8. In a study comparing the effects of 4.5 and 8.5 hours of sleep (sleep deprivation and normal sleep, respectively) in healthy adults, phosphorylated Akt and total Akt responses, which are important steps in the insulin signaling pathway, were found to be lower after sleep deprivation9. The study also found that sleep deprivation also resulted in insulin resistance at the cell-signaling level. In healthy normal-weight adolescent males, decreased insulin sensitivity has been observed following acute sleep restriction, such as 4 hours for three nights in a row10.
Agomelatine is an analog of melatonin, and it has a good binding affinity to MT1 and MT2 receptors. IP is a hydrophilic compound, but basically, it is derived from a lipid moiety; it can bind to IPR present on endoplasmic reticulum (ER), causing a rise in Ca level. Calcium release-activated channel (CRAC) is a specialized plasma membrane Ca ion channel. When Ca is depleted in the ER (a major store of Ca) of pancreatic β-cells, the CRAC channel is activated to slowly replenish it. Sarco/endoplasmic reticulum Ca ATPase (SERCA) is an intracellular membrane-bound enzyme that utilizes the free energy of ATP to transport Ca against a concentration gradient. The physiological role of SERCA is to sequester cytosolic Ca into membrane-bound intracellular compartments. The drug thapsigargin (an antagonist of SERCA) may be used to release this stored Ca as a general messenger for cellular signaling11, and will be used mainly for maintaining the concentration of Ca in the cytoplasm via inhibition of the incorporation of Ca ions into ER. 2-APB is a membrane-permeable modulator of intracellular inositol triphosphate (IP3)-induced calcium release12. Even though a wide array of diabetes therapies are available, adverse effects, limited efficacy, and cost significantly limit their use11. The presence of circadian control over pancreatic function and low levels of melatonin in type 2 diabetic patients proposes a new approach for the development of diabetes therapeutics.
Methods
Maintenance of cell culture
The MIN6 cell line was procured from National Centre for Cell Science (NCCS), Pune. Cell lines were maintained in Dulbecco's Modified Eagle's Medium (Sigma-Aldrich Chemicals Private Limited). Cells were passaged once weekly following detachment using trypsin/EDTA (Sigma-Aldrich Chemicals Private Limited)12. The cells were incubated at 37 C until confluent. Then, the cells were seeded at a concentration of 3.5 x 10 cells/ml into a T125 cell culture flask until the flask became fully confluent. The trypan blue dye exclusion test was used to determine the number of viable cells present in cell suspension13. Cells treated with trypan blue were counted using a Countess® Automated Cell Counter.
Induction of diabetes
Prior to the insulin release experiment, the cells were administered streptozotocin (STZ) to induce diabetes. The cells were incubated with a low dose of STZ (Sigma-Aldrich Chemicals Private Limited) (5 mM) for 1 hour14. The media used for incubation with STZ contained 2% FBS (Sigma-Aldrich Chemicals Private Limited) and then discarded off. After that, cells were incubated with KRBB (Sigma-Aldrich Chemicals Private Limited) for 1 hour, and the solution was discarded. STZ treatment was excluded from the positive control experiment.
MIN6 cells exposure experiment
Cell culture well plates were seeded with approximately 6.5 x 10 cells per well in a total volume of 200 μl of media. The cells were seeded to allow two wells per treatment. The plates were incubated at 37 C under a 5% CO atmosphere for 24 hours in DMEM media. The cells were treated with different molar concentrations of agomelatine (Sigma-Aldrich Chemicals Private Limited), thapsigargin (Sigma-Aldrich Chemicals Private Limited), and 2-APB (Sigma-Aldrich Chemicals Private Limited), singly as well as in combination, for 15 hours at 37 C. The treatments were categorized as follows:
Blank: containing media but no cells
Vehicle control 1: Ethanol (Sigma-Aldrich Chemicals Private Limited)
Vehicle control 2: DMSO (Sigma-Aldrich Chemicals Private Limited)
Positive control: Cells without streptozotocin treatment and cells with glipizide (Sigma-Aldrich Chemicals Private Limited) treatment
Group 1: Agomelatine
Group 2: Thapsigargin
Group 3: 2-APB
Group 4: Agomelatine + Thapsigargin
Group 5: Agomelatine + 2-APB
Group 6: Thapsigargin + 2-APB
Group 7 : Agomelatine + Thapsigargin + 2-APB
Experimental design of drug combinations
The combination ratios were kept at an equipotency ratio (i.e., ED ratio) to ensure that each drug's contribution to the combination was approximately equal (
The MIN6 cells were treated with serial dilutions of each drug and drug combination described above. The media used for drug preparation was low glucose media with 2% FBS. Five dilutions (two-fold diluted) of each drug and combination plus controls were tested in two independent experiments with replicate samples. Chou and Talalay proposed ED ratios as the basis for the experimental design17, 1819, 20.
Design of an experiment to determine therapeutic interactions of agomelatine, thapsigarginand 2-APB and their binary and ternary combinations for insulin secretion
|
Single Drug | |||||
|
Drug |
Concentrations | ||||
|
Agomelatine (nM) |
200 |
100 |
50 |
25 |
12.5 |
|
Thapsigargin (μM) |
4 |
2 |
1 |
0.5 |
0.25 |
|
2-APB (μM) |
200 |
100 |
50 |
25 |
12.5 |
|
Two Drugs Combinations | |||||
|
Drug Combination 1 |
0.5 (EC50) |
1 (EC50) |
2 (EC50) |
3 (EC50) |
4 (EC50) |
|
Agomelatine (nM) |
22 |
43 |
87 |
130 |
173 |
|
Thapsigargin (μM) |
0.2 |
0.4 |
0.8 |
1.2 |
1.5 |
|
Drug Combination 2 | |||||
|
Thapsigargin (μM) |
0.2 |
0.4 |
0.8 |
1.2 |
1.5 |
|
2-APB |
18 |
37 |
74 |
111 |
148 |
|
Drug Combination 3 | |||||
|
Agomelatine (nM) |
22 |
43 |
87 |
130 |
173 |
|
2-APB |
18 |
37 |
74 |
111 |
148 |
|
Three Drugs Combinations | |||||
|
Drug Combination 4 |
0.5 (EC50) |
1 (EC50) |
2 (EC50) |
3 (EC50) |
4 (EC50) |
|
Agomelatine (nM) |
22 |
43 |
87 |
130 |
173 |
|
Thapsigargin (μM) |
0.2 |
0.4 |
0.8 |
1.2 |
1.5 |
|
2-APB (μM) |
18 |
37 |
74 |
111 |
148 |
Measurement of insulin levels
The different formulations of varying molarities of drugs and their combinations were administered, the cells incubated for 15 hours, and then the supernatant was collected for insulin quantification. The quantity of insulin was assessed by Rat/Mouse Insulin ELISA kit (Sigma-Aldrich Chemicals Private Limited), a Sandwich ELISA method. The activity of horseradish peroxidase in the presence of the substrate 3,3',5,5'-tetramethylbenzidine was used to quantify immobilized antibody-enzyme conjugates. After acidification of products, enzyme activity was evaluated spectrophotometrically by the increased absorbency at 450 nm, corrected from the absorbency at 590 nm.
Statistical analysis
The three-drug combination was carried out17, and data were analyzed using the CompuSyn computer software package. The drugs and their combined data were analyzed to determine whether there were significant difference sbetween treatments using analysis of variance (ANOVA). Post hoc analysis was done using Dunnett's test to compare the treatment groups with controls, in order to identify the treatments with the strongest effects. One-way ANOVA and Dunnett's test was carried out using Minitab.
Insulin level on exposure to agomelatine, thapsigargin and 2-APB
|
S.No |
Exposure Group and insulin level |
Concentrations | ||||
|---|---|---|---|---|---|---|
|
1 |
Agomelatine (nM) |
200 |
100 |
50 |
25 |
12.5 |
|
Insulin level (ng/mL) |
28.857 |
29.704 |
28.914 |
28.920 |
28.879 | |
|
2 |
Thapsigargin (μM) |
4 |
2 |
1 |
0.5 |
0.25 |
|
Insulin level (ng/mL) |
27.868 |
28.339 |
27.829 |
26.432 |
25.525 | |
|
3 |
2-APB (μM) |
200 |
100 |
50 |
25 |
12.5 |
|
Insulin level (ng/mL) |
25.761 |
26.691 |
26.113 |
26.167 |
25.821 | |
Drug dose and Combination index (CI) values of agomelatine, thapsigargin and 2-APB with MIN 6 in binary and ternary combinations
|
S.No. |
Drugs combinations (μM) |
CI values |
|---|---|---|
|
1. |
Agomelatine + Thapsigargin | |
|
(i) |
1.673 |
0.08704 |
|
(ii) |
1.33 |
0.04140 |
|
(iii) |
0.887 |
0.03978 |
|
(iv) |
0.443 |
0.01943 |
|
(v) |
0.222 |
0.00974 |
|
2. |
Thapsigargin + 2-APB | |
|
(i) |
149.5 |
0.05615 |
|
(ii) |
112.2 |
0.17927 |
|
(iii) |
74.8 |
0.10518 |
|
(iv) |
37.4 |
0.20425 |
|
(v) |
18.2 |
0.02882 |
|
3. |
Agomelatine + 2-APB | |
|
(i) |
148.173 |
2.57705 |
|
(ii) |
111.13 |
0.04467 |
|
(iii) |
74.087 |
0.05587 |
|
(iv) |
37.043 |
7.02E-5 |
|
(v) |
18.022 |
3.83E-5 |
|
4. |
Agomelatine + Thapsigargin + 2-APB | |
|
(i) |
149.673 |
1.20476 |
|
(ii) |
112.33 |
3.73327 |
|
(iii) |
74.887 |
6.62564 |
|
(iv) |
37.443 |
0.67536 |
|
(v) |
18.222 |
0.64944 |
Results
Measurement of insulin levels in the presence of single and combined drugs
In the presence of single drugs
Standard curves for insulin absorbance were constructed using calibration samples of known concentration, and the R-squared values of the curves were used as a data analysis tool to correlate insulin level and absorbance. The cells were exposed to ethanol at 200 μM and DMSO at 4 μM as vehicle controls to check for any effect of these on insulin excretion from the cells. These solutions were found to have no effect on insulin secretion. DMSO containing the compound of interest at a known concentration was diluted with media and added to wells. After 15 hours, the media was collected for insulin content analysis.
Agomelatine
For agomelatine exposure, DMSO was added to 2 control wells. The duplicate cells were exposed to agomelatine at 200 nM, 100 nM, 50 nM, 25 nM and 12.5 nM (
Thapsigargin
The cells were exposed to thapsigargin at 4 μM, 2 μM, 1 μM, 0.5 μM and 0.25 μM (
2-APB
The cells were treated with 2-APB at 200 μM, 100 μM, 50 μM, 25 μM and 12.5 μM (
In the presence of the combination of drugs
In order to determine synergism or antagonism between drugs, it is essential to know the "potency" and the "shape" of the dose-effect curve for each drug. The ED of each medication was calculated in the previous sections, and the constant combination ratio experiment was conducted at an equipotency ratio [e.g., ED/ED ratio] to ensure that the contributions of each drug's effects to the combination were nearly equal. The dose limits were defined from the single drug test to encompass concentrations below and above the ED values of each compound.

The fa–CI plot (Combination index plot) for binary and ternary combination of agomelatine, thapsigargin and 2-APB with MIN 6 for the insulin ELISA test. Computer simulation (CompuSyn) plots CI values as a function of the fractional insulin secretion (fa) from 0.10 to 0.95. CI < 1 indicates synergism, CI = 1 indicate additive effect, and and CI > 1 imply antagonism.
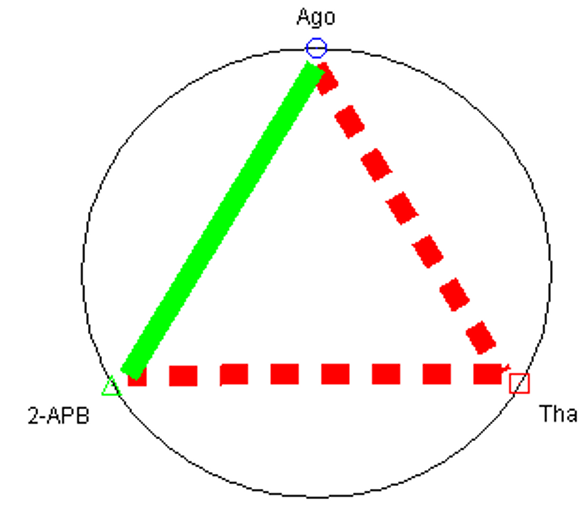
Polygonogram showing the therapeutic interactions of agomelatine, thapsigargin and 2-APB with MIN 6 for the level of insulin secreted by the cells.
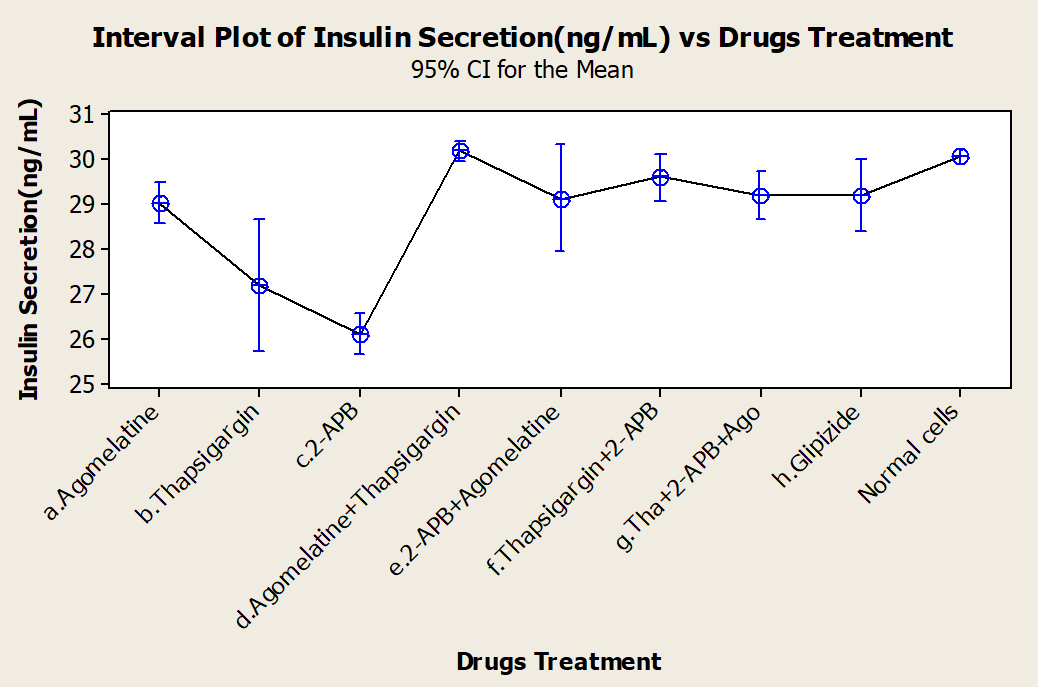
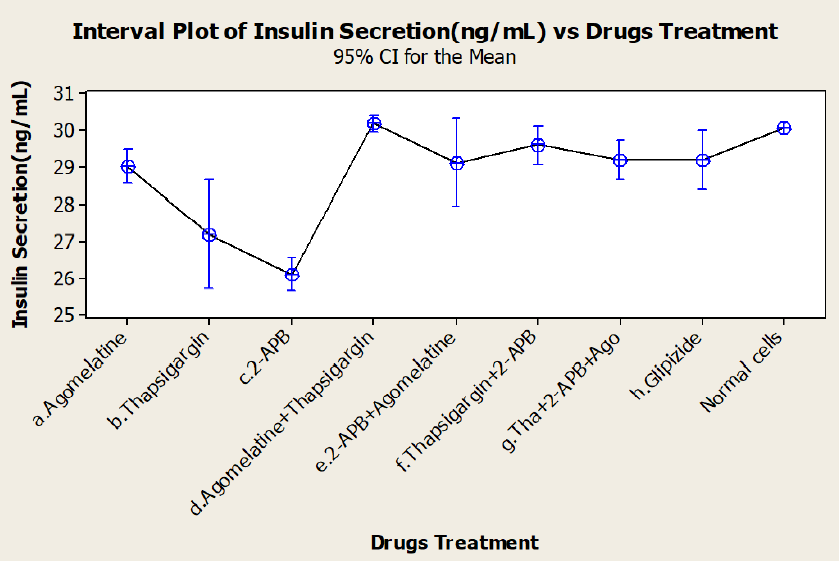
Interval plot displaying the mean and confidence interval of each group.
Therapeutic interaction of agomelatine, thapsigargin, and 2-APB with MIN 6 in binary and ternary combinations
The fa–CI plots of binary and ternary combinations for insulin ELISA are shown in Figure 1. The CI value versus fa (fraction of insulin secretion with respect to the control) is shown as fa-CI plot. The CI values for the different drugs at different dose levels are also shown in
The interaction of two and three medication combinations through quantitative values of CI at f= 0.9 shows that agomelatine and 2-APB yielded synergistic effects, but agomelatine + thapsigargin and thapsigargin +2-APB were particularly antagonistic to one another in regards to insulin secretion by MIN6 cells. The concept of the polygonogram comes not from mathematical derivations but rather from its practical utility17. To some extent, the polygonogram can also be used to project (or predict) the outcomes of drug combinations even when the tests have not yet been completed21(Figure 2).
Analysis of results
One-way ANOVA tests of the various drug treatments were performed (Figure 3). We sought to identify any differences in the efficacies of the drugs, alone or in combination, and discovered that mean insulin responses were not equal; thus, treatments did have different effects on the insulin responses of the cells. Dunnett's test was used as a post hoc analysis tool for multiple comparison procedures to compare each different treatment group with a single control. It established confidence intervals for the differences between the means of each treatment and the mean of a control group; intervals that contained zero was not significantly different from the control. Based on Dunnett's test, we concluded that while thapsigargin and 2-APB inhibited insulin secretion when alone, when in combination, they stimulated insulin secretion.
Discussion
Clinical trials of combination therapies for type 2 diabetes are routinely undertaken experimentally. Extensive pharmacologic and efficacy research is always conducted prior to phase I clinical trials for single medicines. In most circumstances, pharmacological combinations produce unpredictable consequences; in a sense, combining two medications creates a third drug, with unique characteristics beyond the sum of its parts.
We believe that some supporting data should be provided when clinical studies invite research into medication combinations. The goal of the current research was to undertake in vitro drug combination investigations before putting them into clinical trials, especially for novel medications, using a quantitative study of synergism or antagonism at various medication dosages and effect levels. Prospective in vitro experiments were carried out, as shown in this paper, and they provide most of the necessary information for rational protocol design. The three drugs that we used in our study are agomelatine, thapsigargin, and 2-APB, none of which are directly linked with the mechanism of insulin secretion. Agomelatine is a melatonin (MT1/MT2) agonist22, thapsigargin is the most widely used inhibitor of the ubiquitous SERCA proteins in mammalian cells23, 22, while 2-APB transiently activates ORAI1-mediated Ca entry23. In this work, for the first time, we described the therapeutic interactions of three drugs in stimulating insulin release by cultured pancreatic cells. However, other melatonergic agonists24 and melatonin itself have been analyzed for diabetic complications under the influence of these agents22, 23, 25, 26. Thapsigargin and 2-APB have the lowest mean insulin release, but showed synergistic behavior in combination with each other and the third drug when compared through ANOVA. Dunnett's test was applied to identify which drugs and/or combinations favor insulin secretion as in normal and healthy cells. The cells treated with streptozotocin to induce diabetes of course had a lower level of insulin secretion than untreated cells.
The combination index theorem27, a method frequently used to analyze drug interactions in pharmacology, was utilized to investigate the nature of combined drug interactions (synergism, additive impact, or antagonism) on insulin secretion. For drug interactions, this method may be regarded as a fractional analysis tool28, 29 which is independent of the mechanism of action and includes both the potency (ED, Dm) and the shape (m) of each drug's dose-effect curve. For a combination of n medications, this approach can predict synergism/antagonism at all effect levels (fa). We determined the type of interactions in MIN6 cells using this method over a wide range of effect levels for each single drug and combination. The Polygonogram depicted the synergistic effect of agomealtine and 2-APB (Figure 3). Furthermore, there have been very few findings on possible targets of the PLC/IP3 pathway via melatonin receptors for diabetes therapy.
The determination of synergism or antagonism was based on the principle of mass action and its related equations; this determination is independent of mechanisms of action. Thus, dose-independent behavior of drugs towards insulin secretion might be attributed to the secondary effect of the drug. This could be an interaction between the biological pathways, or cell proliferation due to Ca acting as a secondary messenger. In many drug combinations, each drug may have more than one mode of action, and synergism may be due to reasons other than a particular mechanism of action. The present study emphasizes the quantitative effects of the various drug treatments on insulin secretion, and does not explore the specific mechanisms of the synergistic or antagonistic interactions identified.
Conclusions
When individual drugs were tested, thapsigargin and 2-APB showed a lowered level of insulin secretion which could be considered a suppressive effects on cells. The CI method predicted synergism in agomelatine and 2-APB, which may have therapeutic implications for diabetes. In this study we present the first example of three distinct medications being examined with the quantitative CI approach for insulin stimulation in MIN6 cells. Among the three drugs selected for the study, agomelatine, thapsigargin, and 2-APB each have demonstrated utility other than insulin secretion. Application of agomelatine and 2-APB together may be a novel therapeutic avenue for type 2 diabetes.
Abbreviations
2-APB: 2-Aminoethoxydiphenyl borate; cAMP: Cyclic adenosine monophosphate; IP3: Inositol trisphosphate; MIN6: Mouse INsulinoma 6; PLC: Phospholipase C
Acknowledgments
We would also like to show our gratitude to the (Dr. Himanshu Kumar, Associate Professor, Indian Institute of Science Education and Research Bhopal and Dr. Archana Tiwari, Director, School of Bio-Technology, UTD, RGPV Bhopal) for sharing their pearls of wisdom with us during the course of this research.
Author’s contributions
Data and materials used and analyzed during the current study are available from the corresponding author on reasonable request.
Funding
None.
Availability of data and materials
Data and materials used and/or analyzed during the current study are available from the corresponding author on reasonable request.
Ethics approval and consent to participate
Not applicable.
Consent for publication
Not applicable.
Competing interests
The authors declare that they have no competing interests.