


Transcriptional Upregulation of Leukemia Inhibitory Factor in Peripheral Blood of Patients with Heart Failure and Its Association with Inflammatory and Myocardial Stress Biomarkers

- Department of Anatomy, Meenakshi Academy of Higher Education and Research (Deemed to be University), Chennai, Tamil Nadu, India
- Department of ENT, Meenakshi Medical College Hospital and Research Institute, Meenakshi Academy of Higher Education and Research (Deemed to be University), Kanchipuram, Tamil Nadu, India
- Department of Anatomy, Meenakshi Medical College Hospital and Research Institute, Meenakshi Academy of Higher Education and Research (Deemed to be University), Kanchipuram, Tamil Nadu, India
- Department of Anatomy, Saveetha Medical College and Hospital, Saveetha Institute of Medical and Technical Sciences, Chennai, Tamil Nadu, India
- Department of Cytogenetics, Genetika, Centre for Advanced Genetic Studies, Thiruvananthapuram, Kerala, India
Abstract
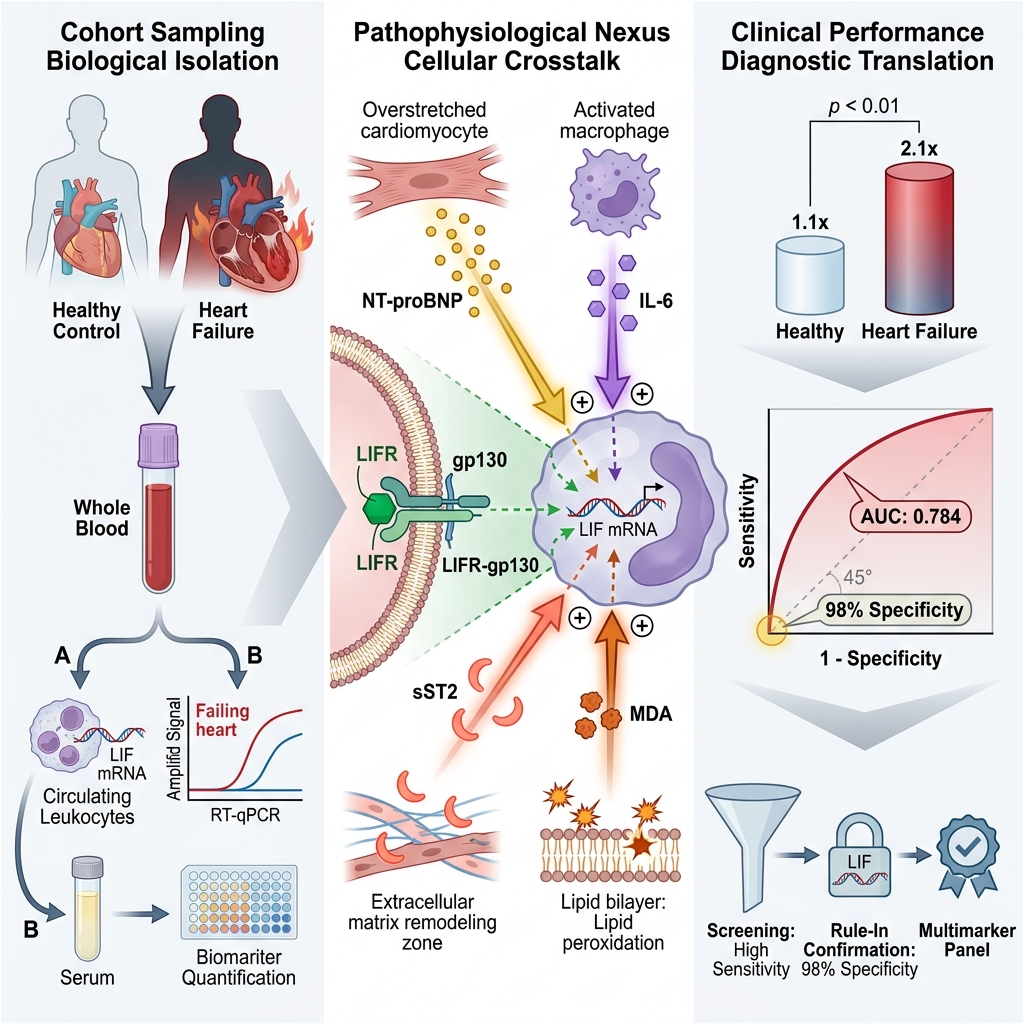
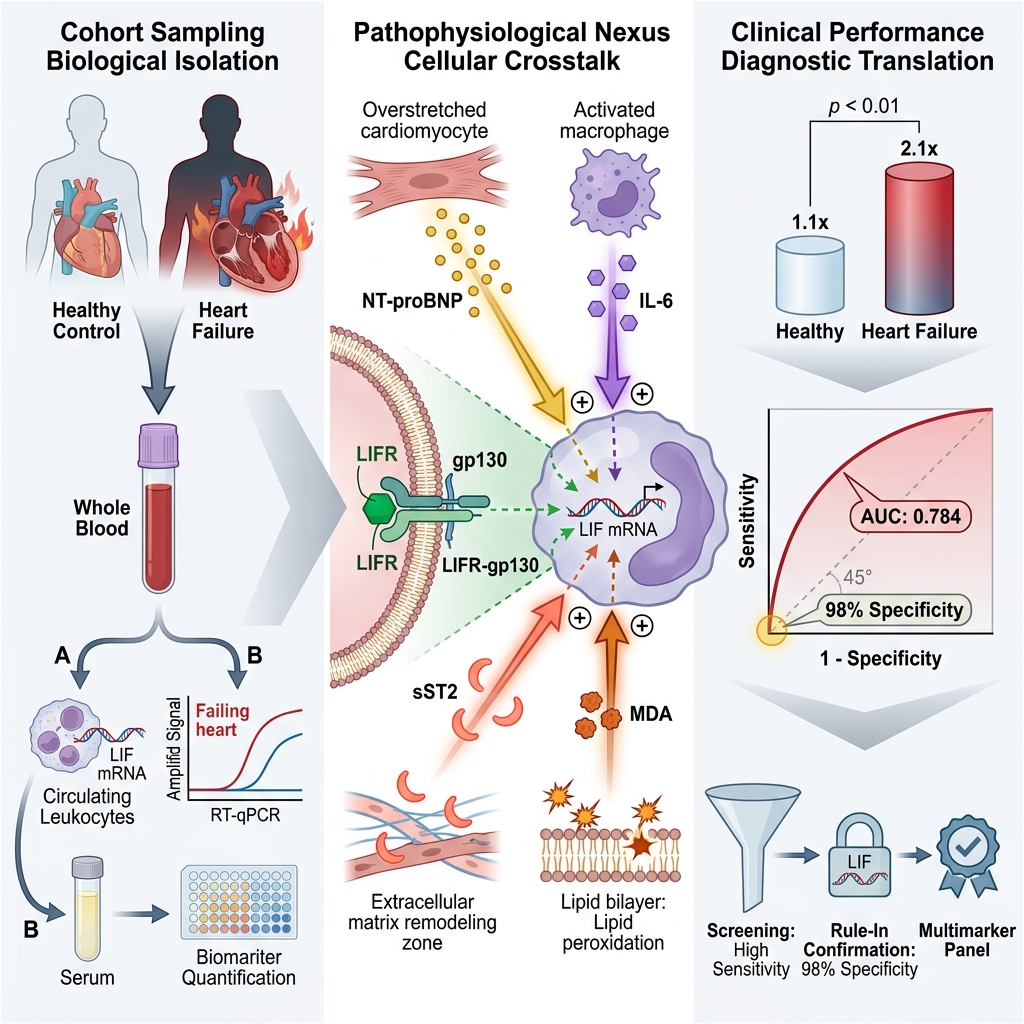
Background: Heart failure (HF) is a complex clinical syndrome characterized by sustained inflammatory activation, oxidative stress, and extensive alterations in gene regulation. Leukemia inhibitory factor (LIF), a pleiotropic cytokine belonging to the interleukin-6 (IL-6) superfamily, mediates cellular stress signaling through the glycoprotein 130 (gp130) receptor complex. Although previous investigations have predominantly examined LIF expression in experimental animal models or endomyocardial biopsies, clinical evidence regarding peripheral blood LIF gene expression in human HF remains limited. This study aimed to investigate peripheral blood LIF transcript levels in a South Indian cohort and evaluate its diagnostic performance and potential utility as a complementary transcriptional biomarker within a multimarker framework.
Methods: In this hospital-based case–control study, 150 patients with clinically confirmed stable HF and 150 age- and sex-matched healthy controls were enrolled across cardiac centers in Kerala, India. Peripheral blood LIF messenger RNA (mRNA) expression was quantified by reverse transcription quantitative polymerase chain reaction (RT-qPCR) using the 2−ΔΔCt relative quantification method normalized to glyceraldehyde-3-phosphate dehydrogenase (GAPDH). Circulating concentrations of established cardiac stress, inflammatory, oxidative stress, and myocardial remodeling biomarkers—specifically N-terminal pro-B-type natriuretic peptide (NT-proBNP), interleukin-6 (IL-6), malondialdehyde (MDA), and soluble suppression of tumorigenicity 2 (sST2)—were determined by enzyme-linked immunosorbent assay (ELISA). Diagnostic accuracy was evaluated using receiver operating characteristic (ROC) curves, and independent associations were assessed via sequential multivariable logistic regression models.
Results: Peripheral blood LIF gene expression was significantly upregulated in patients with HF compared with healthy controls (mean fold change: 2.1 ± 1.2 vs. 1.1 ± 0.2, p < 0.01). Circulating levels of NT-proBNP, IL-6, sST2, and MDA were also significantly elevated in HF cases (all p < 0.01). ROC curve analysis demonstrated robust diagnostic accuracy for LIF gene expression, with an area under the curve (AUC) of 0.784 (95% CI: 0.732–0.836), achieving a sensitivity of 58%, an exceptional specificity of 98%, and a positive likelihood ratio of 29.0. Bivariate analysis revealed significant positive correlations between LIF expression and NT-proBNP (ρ = 0.5146, p < 0.001), IL-6 (ρ = 0.4425, p < 0.001), sST2 (ρ = 0.5321, p < 0.001), and MDA (ρ = 0.4371, p < 0.001). In binary logistic regression, LIF expression exhibited a powerful unadjusted association with HF (Model 1: OR = 15.123, 95% CI: 6.300–36.303, p < 0.01) that persisted after adjusting for age, sex, and body mass index (Model 2: OR = 6.220, p < 0.01) and hypertension (Model 3: OR = 3.248, p = 0.014). However, upon full adjustment for circulating NT-proBNP, IL-6, MDA, and sST2 (Model 4), the association was attenuated to non-significance (adjusted OR = 0.625, 95% CI: 0.202–1.935, p = 0.415).
Conclusions: Peripheral blood LIF gene expression is markedly elevated in patients with HF and correlates with established biomarkers of myocardial wall stress, systemic inflammation, lipid peroxidation, and cardiac fibrosis. The loss of independent predictive significance upon comprehensive multivariable adjustment indicates that peripheral LIF transcription reflects shared biological and signaling variance within the broader gp130 cytokine and myocardial stress cascade. Consequently, peripheral LIF mRNA expression serves as a valuable complementary molecular indicator for disease phenotyping rather than an isolated standalone diagnostic biomarker.
Graphical abstract
Introduction
Heart failure (HF) is a progressive clinical syndrome characterized by structural or functional impairment of ventricular filling or ejection fraction, resulting in elevated intracardiac pressures and inadequate systemic tissue perfusion. It remains a major global public health challenge, accounting for substantial hospitalization rates, reduced quality of life, and high cardiovascular mortality worldwide.1 Despite major advances in evidence-based pharmacological treatments and device-based interventions, the clinical trajectory of HF remains heterogeneous and unpredictable, underscoring the urgent need for enhanced diagnostic precision, risk stratification, and molecular phenotyping tools. Circulating biomarkers have become integral to the clinical evaluation of HF, particularly those that directly reflect key pathophysiological processes driving disease progression.2
Among established circulating biomarkers, N-terminal pro-B-type natriuretic peptide (NT-proBNP) is universally recognized as the gold standard for assessing hemodynamic myocardial wall stress and volume overload, playing a central role in guideline-directed diagnosis and prognostication.3 Substantial clinical evidence confirms that circulating NT-proBNP concentrations correlate closely with disease severity, ventricular remodeling, and adverse clinical endpoints. However, NT-proBNP concentrations can be confounded by non-hemodynamic clinical variables—including advanced age, high body mass index (obesity paradox), and renal impairment—which may impair diagnostic specificity in complex clinical scenarios. Concurrently, HF is increasingly recognized as a multifaceted systemic condition driven by chronic low-grade inflammatory activation, reactive oxygen species–mediated oxidative damage, and adverse myocardial extracellular matrix remodeling, processes that are not fully captured by natriuretic peptides alone. Interleukin-6 (IL-6) is a prototypical pro-inflammatory cytokine linked to disease severity, functional deterioration, and adverse cardiovascular outcomes.4 Nonetheless, the clinical utility of IL-6 as an independent diagnostic biomarker is limited by its broad elevation across diverse systemic inflammatory, infectious, and autoimmune conditions. Malondialdehyde (MDA) is a well-established byproduct of lipid peroxidation that reflects systemic oxidative stress, whereas soluble suppression of tumorigenicity 2 (sST2) is an established biomarker of mechanical cardiomyocyte strain, tissue fibrosis, and adverse ventricular remodeling.5,6 Although elevated circulating MDA and sST2 levels are linked to cardiac fibrosis and unfavorable clinical outcomes in HF, each marker in isolation offers only a partial window into the multifaceted biological pathways of the failing myocardium. These diagnostic limitations have driven growing interest in identifying novel, complementary molecular biomarkers that can refine diagnostic confidence and illuminate upstream transcriptional mechanisms underlying HF pathophysiology.
Leukemia inhibitory factor (LIF), a pleiotropic cytokine belonging to the IL-6 superfamily, orchestrates cellular stress signaling, immune modulation, cell survival, and tissue remodeling via the glycoprotein 130 (gp130) and LIF receptor (LIFR) complex.7 Experimental studies in animal models have indicated that LIF plays a complex, dual role in the myocardium, mediating early cardioprotective and anti-apoptotic signaling during acute stress while contributing to hypertrophic and fibrotic remodeling during sustained, chronic activation.8 However, the vast majority of existing literature has evaluated LIF at the protein level or in cardiac tissue specimens obtained from animal models or explanted human hearts, leaving a significant gap in clinical knowledge regarding peripheral blood LIF messenger RNA (mRNA) expression in human HF. Furthermore, the clinical relevance of peripheral blood LIF transcription relative to established circulating markers of inflammation, oxidative stress, and myocardial remodeling remains unexplored.
The state of Kerala in southern India exhibits an exceptionally high epidemiological burden of cardiovascular disease and associated cardiometabolic risk factors, including high prevalence rates of type 2 diabetes mellitus, hypertension, and obesity, all of which contribute substantially to the development and progression of HF. Despite this elevated regional burden, clinical investigations examining peripheral blood molecular and transcriptional biomarkers—particularly LIF gene expression—in HF cohorts from southern Kerala are lacking. Region-specific data are essential because distinct genetic backgrounds, environmental exposures, and lifestyle factors can influence molecular biomarker expression and clinical disease phenotypes. Therefore, the present study was designed to evaluate peripheral blood LIF gene expression in patients with HF and to examine its correlation with established biomarkers of myocardial wall stress (NT-proBNP), inflammation (IL-6), oxidative stress (MDA), and myocardial remodeling (sST2) in a cohort from southern Kerala. By integrating LIF into a comprehensive multimarker framework, this study seeks to determine its potential role as a complementary transcriptional biomarker in heart failure.
Materials and Methods
Study Population and Ethical Oversight
This hospital-based case–control study was conducted in accordance with the ethical principles outlined in the Declaration of Helsinki (1975, as revised in 2003) and was reviewed and approved by the Institutional Ethics Committee of Genetika, Centre for Advanced Genetic Studies (Approval Ref. No.: 15/2023/IECG; Dated: 03/08/2023). Prior to participant enrollment, written informed consent was obtained from all participants or their legally authorized representatives. Participant confidentiality, anonymity, and data privacy were strictly maintained throughout the study.
Clinical data and biological specimens were prospectively collected from patients presenting to tertiary cardiac centers across Kerala, India, between January 2023 and January 2025. The clinical diagnosis of HF was independently confirmed by two or more experienced cardiologists based on comprehensive clinical history, physical examination (identifying classic symptoms and physical signs of congestion or low output), 12-lead electrocardiography (ECG), and transthoracic echocardiography according to American Heart Association (AHA) and European Society of Cardiology (ESC) guidelines. Patients were excluded if they met any of the following criteria: (1) presence of acute or chronic systemic infections; (2) end-stage renal disease (estimated glomerular filtration rate < 15 mL/min/1.73 m or ongoing dialysis) or advanced hepatic failure; (3) active malignancy; (4) congenital heart disease; (5) systemic autoimmune or rheumatic immune disorders; or (6) incomplete clinical or laboratory records.
A total of 150 patients with clinically confirmed, stable HF who met all eligibility criteria were consecutively enrolled in the case group. Simultaneously, 150 age- and sex-matched healthy control individuals (n = 150) were recruited from community health screening programs conducted in the same geographic region during the identical time period. All potential control subjects underwent comprehensive clinical history taking, physical examination, 12-lead ECG, and baseline biochemical evaluation to rigorously exclude cardiovascular disease, hypertension, diabetes mellitus, renal dysfunction, or other major systemic comorbidities prior to enrollment. The final study cohort comprised 300 participants (150 HF cases and 150 healthy controls). Figure 1 outlines the participant screening, recruitment, and enrollment flow.
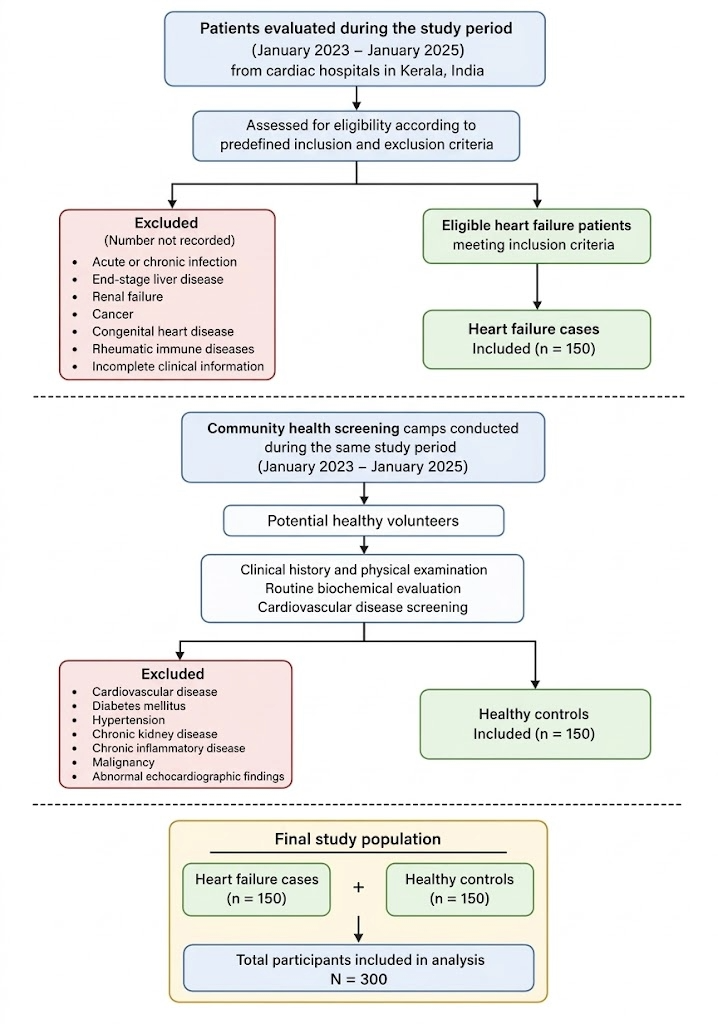
Flowchart illustrating the systematic recruitment, screening, exclusion, and final allocation of the study participants into heart failure cases and matched healthy control cohorts. Patients presenting with chronic stable heart failure were screened across tertiary cardiac centers in Kerala, India, between January 2023 and January 2025. Age- and sex-matched healthy control subjects were concurrently recruited from community health screening programs. Structured clinical criteria, laboratory evaluations, 12-lead ECG, and echocardiography were applied to verify inclusion and exclusion criteria. From screened candidates, individuals with acute or chronic infections, end-stage renal or liver failure, active malignancies, congenital heart defects, autoimmune disorders, or incomplete clinical records were excluded. A final cohort of 300 participants (n = 150 confirmed HF cases and n = 150 healthy controls) successfully completed biological sampling and molecular/biochemical profiling.
Sample Size Determination
The required sample size was calculated using the standard formula for comparing two independent means:9
where Z = 1.96 corresponds to a two-sided significance level (α) of 0.05, Z = 0.84 provides 80% statistical power (β = 0.20), σ represents the pooled standard deviation, and Δ is the expected clinically meaningful difference between group means. Given the paucity of published baseline data on peripheral blood LIF mRNA expression in human HF cohorts at the time of study initiation, a conservative moderate effect size (Cohen’s d = 0.5) was assumed. While myocardial tissue studies have reported large effect sizes for LIF expression (Cohen’s d > 0.8),10 peripheral blood transcriptomic measurements exhibit greater biological and inter-individual variability. Based on these parameters (α = 0.05, power = 80%, Cohen’s d = 0.5), a minimum sample size of 63 participants per group was required. To ensure robust statistical power for multivariable logistic regression modeling, subgroup comparisons, and receiver operating characteristic (ROC) analyses, the final cohort was expanded to 150 HF patients and 150 matched healthy controls (total N = 300).
Diagnostic Criteria and Definitions
The following operational definitions were applied throughout the investigation:
Heart Failure Cases: Defined as adult patients with clinically documented, chronic stable HF diagnosed in accordance with standard AHA/ESC guidelines, supported by documented clinical signs and symptoms of HF, echocardiographic evidence of cardiac structural or functional abnormalities, and elevated biomarkers.
Healthy Controls: Defined as apparently healthy individuals with no prior history, symptoms, or clinical signs of cardiovascular disease. All control participants demonstrated normal 12-lead ECG recordings, normal blood pressure, normal fasting glucose, and absence of systemic hypertension, diabetes mellitus, chronic kidney disease, chronic inflammatory disorders, or oncological history.
Clinical and Laboratory Data Collection
Standardized clinical proformas were used to record baseline demographic parameters, including age, sex, body mass index (BMI, kg/m), smoking history, and pre-existing comorbidities (hypertension, type 2 diabetes mellitus, and coronary artery disease). Following an 8- to 12-hour overnight fast, 6 to 8 mL of peripheral venous blood was drawn from the antecubital vein of each participant using sterile, vacuum-assisted venipuncture under resting conditions.
Blood samples were collected into two specialized Vacutainer tubes: (1) clot activator tubes for serum separation and biomarker estimation (NT-proBNP, IL-6, MDA, and sST2), and (2) sterile ethylenediaminetetraacetic acid (EDTA) tubes for total RNA extraction and subsequent transcriptomic analysis. Clot activator tubes were allowed to clot completely at room temperature (22–25 °C) for 30 minutes, followed by centrifugation at 3,000 rpm for 15 minutes at 4 °C. The separated serum was aliquoted into sterile cryovials and stored at −80 °C until batch ELISA analysis. EDTA whole blood samples were processed promptly for RNA isolation to prevent enzymatic degradation.
Circulating Biomarker Quantification by ELISA
Serum concentrations of cardiac, inflammatory, oxidative, and remodeling biomarkers were quantified using commercially available, high-sensitivity enzyme-linked immunosorbent assay (ELISA) kits in strict accordance with the manufacturers’ standard operating protocols:
-
NT-proBNP: Measured using a quantitative sandwich ELISA kit (Origin Diagnostics and Research, India; Cat. No.: OPK1212). Standards and serum samples were added to microplate wells pre-coated with a monoclonal anti-NT-proBNP capture antibody. Following incubation and washing, a biotinylated secondary detection antibody and streptavidin–horseradish peroxidase (HRP) conjugate were added. Chromogenic development was achieved using 3,3′,5,5′-tetramethylbenzidine (TMB) substrate and halted with sulfuric acid stop solution. Optical density (OD) was measured at 450 nm (with wavelength correction at 630 nm) on a Multiskan FC microplate reader (Thermo Fisher Scientific, Waltham, MA, USA). Absolute concentrations were calculated using a four-parameter logistic (4-PL) standard curve.
-
Interleukin-6 (IL-6): Quantified using a high-sensitivity sandwich ELISA kit (Origin Diagnostics and Research, India; Cat. No.: OPK1156). Serum samples were incubated in capture antibody–coated wells, followed by HRP-conjugated detection antibody chemistry, TMB color development, and absorbance measurement at 450 nm. Concentrations were derived from standard calibration curves.5
-
Soluble ST2 (sST2): Determined using a sandwich ELISA kit (Origin Diagnostics and Research, India; Cat. No.: OPK9271) specific for human sST2. Absorbance was read at 450 nm, and concentrations were interpolated from a validated 4-PL standard curve.
-
Malondialdehyde (MDA): Quantified as an index of lipid peroxidation using a competitive ELISA kit (Origin Diagnostics and Research, India; Cat. No.: OPK8428). In this assay format, endogenous serum MDA competes with pre-coated MDA–protein conjugate for specific antibody binding sites, resulting in an inverse relationship between absorbance at 450 nm and sample MDA concentration. Final concentrations were determined from an inhibition standard curve fitted with a 4-PL algorithm.
All ELISA assays were performed in duplicate. Internal quality-control standards were included in each run, and an intra-assay coefficient of variation (CV) of < 10% was maintained across all plates.
Leukemia Inhibitory Factor (LIF) Gene Expression Analysis
Total RNA was extracted from whole blood collected in EDTA tubes using a silica column-based RNA isolation kit (Origin Diagnostics and Research, India; Cat. No.: ODP419). Briefly, 250 μL of whole blood was lysed with three volumes of lysis buffer (Buffer RZ), followed by phase separation with 150 μL of analytical-grade chloroform and centrifugation at 12,000 rpm for 10 minutes at 4 °C. The upper aqueous phase was transferred into an RNase-free microcentrifuge tube, mixed with an equal volume of absolute ethanol (96%–100%), and applied to a silica-membrane spin column (CR3). Spin columns were washed sequentially with Buffer RP and Buffer RW to remove protein and salt impurities. After centrifugation to remove residual ethanol, purified total RNA was eluted in 30–100 μL of nuclease-free water. RNA yield and purity were determined spectrophotometrically using A260/A280 absorbance ratios on a NanoDrop spectrophotometer.
Complementary DNA (cDNA) was synthesized from 50 ng of purified total RNA using a specialized reverse transcription kit (Origin Diagnostics and Research, India; Cat. No.: ODR41). Each 20 μL reaction mixture contained RNA template, 0.5 μL of oligo(dT) primer, 0.5 μL of random hexamer primers, 10 mM dNTP mix, 5× RT buffer, and reverse transcriptase enzyme. Reverse transcription was performed on a thermal cycler under the following conditions: primer annealing at 25 °C for 5 minutes, enzymatic cDNA synthesis at 50 °C for 60 minutes, and enzyme inactivation at 95 °C for 5 minutes. The resulting cDNA was stored at −20 °C until real-time amplification.
Reverse transcription quantitative polymerase chain reaction (RT-qPCR) was performed using SYBR Green chemistry on a Bio-Rad CFX Opus 96 Real-Time PCR System (Bio-Rad Laboratories, Hercules, CA, USA). Each 20 μL reaction volume contained 10 μL of 2× SYBR Green Master Mix, 1 μL of forward primer (10 μM), 1 μL of reverse primer (10 μM), 2 μL of cDNA template, and 6 μL of nuclease-free water. Target-specific oligonucleotide primers for human LIF (RefSeq: NM_002309.5) and the reference housekeeping gene glyceraldehyde-3-phosphate dehydrogenase (GAPDH; RefSeq: NM_002046.7) were designed using the NCBI Primer-BLAST tool and commercially synthesized by Eurofins Genomics India Pvt. Ltd. (Bangalore, India).11 Primer sequences are summarized in Table 1.
Primer Sequences Used for RT-qPCR Amplification of Target and Housekeeping Genes.
| Gene Target | Forward Primer Sequence (5′ → 3′) | Reverse Primer Sequence (5′ → 3′) | Amplicon Length (bp) | GenBank Accession No. |
|---|---|---|---|---|
| LIF | 5′-AGA TCA GGA GCC AAC TGG CAC A-3′ | 5′-GCC ACA TAG CTT GTC CAG GTT G-3′ | 182 | NM_002309.5 |
| GAPDH | 5′-CCA TGG AGA AGG CTG GGG-3′ | 5′-CAA AGT TGT CAT GGA TGA CC-3′ | 195 | NM_002046.7 |
Thermal cycling parameters consisted of an initial denaturation step at 94 °C for 1 minute, followed by 40 amplification cycles of denaturation at 94 °C for 15 seconds, primer annealing at 58 °C for 1 minute, and a final extension at 72 °C for 10 minutes. A continuous dissociation (melt-curve) analysis was conducted from 65 °C to 95 °C with increments of 0.5 °C to confirm reaction specificity and verify the absence of primer dimers or non-specific amplicons.
Data Analysis and Expression Quantification
Fluorescence quantification cycle (C) values were exported from the Bio-Rad CFX Maestro software. Mean C values from duplicate wells were used for all quantitative calculations. Relative fold changes in LIF mRNA expression were calculated using the comparative 2 method, where ΔC = C − C, and ΔΔC = ΔC − mean ΔC. Melting curve profiles confirmed a single, distinct peak for all target and reference reactions (Figure 2).
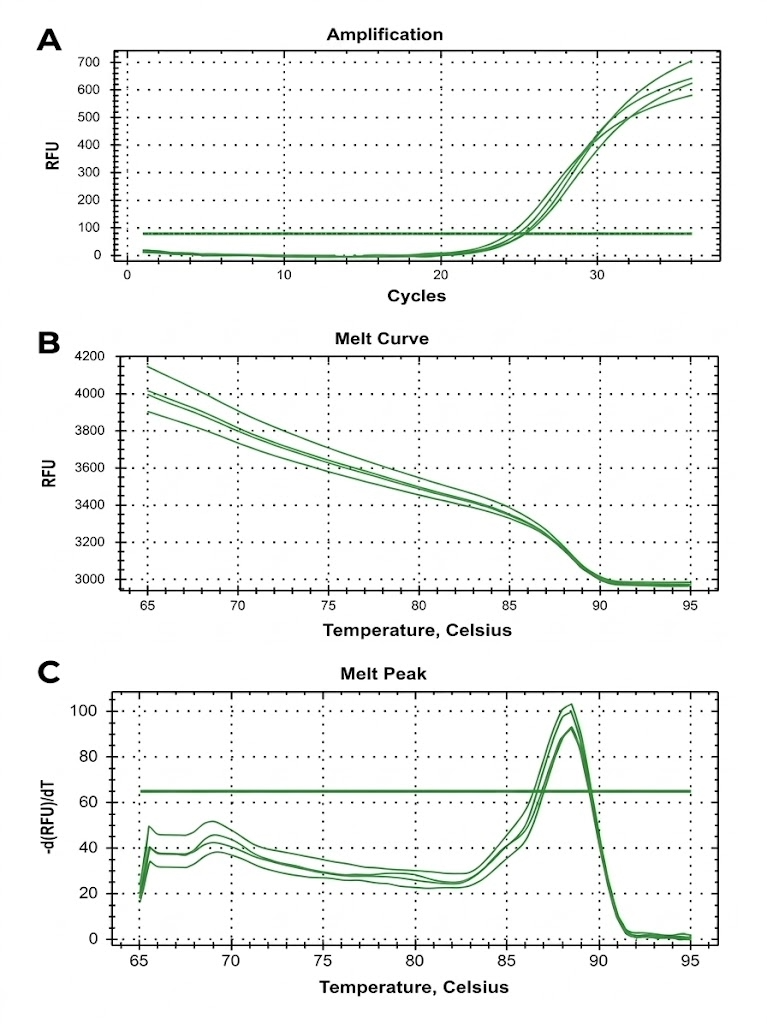
Real-time quantitative PCR amplification profiles and dissociation (melt) curve kinetics demonstrating high analytical specificity and primer efficiency for human
Statistical Analysis
Statistical computations were performed using Stata statistical software version 17.0 (StataCorp LLC, College Station, TX, USA). Continuous variables were assessed for distributional normality using the Shapiro–Wilk test; non-normally distributed continuous data are presented as mean ± standard deviation (SD) and were compared between groups using the non-parametric Mann–Whitney U test. Categorical variables are reported as frequencies and percentages (n (%)) and were compared using Pearson’s Chi-square (χ) test.
Diagnostic performance and discriminative accuracy of LIF gene expression and circulating biomarkers were evaluated using receiver operating characteristic (ROC) curve analysis. The area under the ROC curve (AUC) and 95% confidence intervals (CIs) were computed, and optimal cut-off values were identified using the Youden index (J = sensitivity + specificity − 1) to determine corresponding sensitivities, specificities, positive likelihood ratios (LR), and negative likelihood ratios (LR). Bivariate relationships between LIF gene expression and circulating biomarkers (NT-proBNP, IL-6, sST2, and MDA) were evaluated using Spearman rank correlation coefficients (ρ) and linear regression coefficients of determination (R).
To examine the independent association between LIF gene expression and HF status, sequential multivariable binary logistic regression models were constructed: Model 1 was unadjusted; Model 2 was adjusted for age, sex, and BMI; Model 3 was additionally adjusted for hypertension; and Model 4 (fully adjusted model) incorporated age, sex, BMI, hypertension, NT-proBNP, IL-6, sST2, and MDA. Results are presented as odds ratios (ORs) with corresponding 95% CIs. Potential multicollinearity among regression covariates was formally evaluated using variance inflation factors (VIFs), with a VIF threshold of < 5 indicating acceptable collinearity. All statistical tests were two-tailed, and a p-value < 0.05 was considered statistically significant.
Results
Demographic and Baseline Clinical Characteristics
A total of 300 participants (150 HF cases and 150 healthy controls) were evaluated in this study. The baseline demographic and clinical features of the study cohort are presented in Table 2. The mean age was 46.6 ± 9.3 years in the HF group and 45.6 ± 9.8 years in the control group, demonstrating no statistically significant difference (p = 0.254). The sex distribution was also well-balanced between groups (females: 53.3% in cases vs. 52.0% in controls; males: 46.7% in cases vs. 48.0% in controls; p = 0.817), confirming successful matching. Conversely, HF patients exhibited a significantly higher prevalence of obesity (62.0% vs. 11.3%, p < 0.01) and clinical hypertension (40.7% vs. 0.0%, p < 0.01) compared with healthy controls.
Distribution of Demographic and Baseline Clinical Characteristics Among Heart Failure Cases and Matched Healthy Controls
| Variable | Category | HF Cases (n = 150) n (%) | Healthy Controls (n = 150) n (%) | Total Cohort (N = 300) n (%) | ||
|---|---|---|---|---|---|---|
| Sex | Female | 80 (53.3%) | 78 (52.0%) | 158 (52.7%) | 0.054 | 0.817 |
| Male | 70 (46.7%) | 72 (48.0%) | 142 (47.3%) | |||
| Obesity (BMI ≥ 30 kg/m2) | Yes | 93 (62.0%) | 17 (11.3%) | 110 (36.7%) | 83.56 | < 0.01 |
| No | 57 (38.0%) | 133 (88.7%) | 190 (63.3%) | |||
| History of Hypertension | Yes | 61 (40.7%) | 0 (0.0%) | 61 (20.3%) | 76.54 | < 0.01 |
| No | 89 (59.3%) | 150 (100.0%) | 239 (79.7%) |
Circulating Biomarker Concentrations and LIF Transcriptional Upregulation
As summarized in Table 3, patients with HF demonstrated marked alterations across all evaluated circulating biomarkers and gene expression levels compared with healthy controls. Circulating concentrations of NT-proBNP were significantly higher in HF patients than in controls (142.3 ± 41.0 pg/mL vs. 85.3 ± 34.7 pg/mL, p < 0.01). Similarly, the pro-inflammatory cytokine IL-6 (7.5 ± 3.3 pg/mL vs. 4.3 ± 2.5 pg/mL, p < 0.01), the myocardial remodeling marker sST2 (20.9 ± 9.2 ng/mL vs. 13.1 ± 6.6 ng/mL, p < 0.01), and the oxidative lipid peroxidation marker MDA (4.3 ± 2.7 ng/mL vs. 2.1 ± 1.0 ng/mL, p < 0.01) were significantly elevated in HF cases.
Comparison of Circulating Cardiac Stress, Inflammatory, Oxidative, and Gene Expression Biomarkers Between Cases and Controls
| Biomarker Domain | Evaluated Parameter | Measurement Unit | HF Cases (n = 150) (Mean ± SD) | Healthy Controls (n = 150) (Mean ± SD) | ||
|---|---|---|---|---|---|---|
| Myocardial Wall Stress | NT-proBNP | pg/mL | 142.3 ± 41.0 | 85.3 ± 34.7 | 10.84 | < 0.01 |
| Pro-inflammatory Cytokine | Interleukin-6 (IL-6) | pg/mL | 7.5 ± 3.3 | 4.3 ± 2.5 | 8.92 | < 0.01 |
| Myocardial Remodeling | Soluble ST2 (sST2) | ng/mL | 20.9 ± 9.2 | 13.1 ± 6.6 | 7.86 | < 0.01 |
| Lipid Peroxidation | Malondialdehyde (MDA) | ng/mL | 4.3 ± 2.7 | 2.1 ± 1.0 | 8.45 | < 0.01 |
| Transcriptional Marker | LIF Gene Expression | Fold change (2−ΔΔCt) | 2.1 ± 1.2 | 1.1 ± 0.2 | 9.71 | < 0.01 |
Quantitative RT-PCR analysis demonstrated a significant upregulation of peripheral blood LIF mRNA expression in HF patients compared with healthy controls (mean 2 fold change: 2.1 ± 1.2 vs. 1.1 ± 0.2, p < 0.01). These results establish that active transcriptional induction of LIF is detectable in the peripheral circulation of HF patients alongside elevated systemic markers of myocardial strain, inflammation, and oxidative stress.
Diagnostic Performance of LIF Gene Expression and Biomarkers
The diagnostic utility of peripheral blood LIF gene expression and circulating biomarkers was evaluated using ROC curve analysis (Figure 3). LIF gene expression demonstrated robust diagnostic discriminative ability, yielding an AUC of 0.784 (95% CI: 0.732–0.836). Utilizing the optimal cut-off value determined by the Youden index, LIF expression exhibited a diagnostic sensitivity of 58.0% and an outstanding specificity of 98.0%, resulting in a high positive likelihood ratio (LR) of 29.0.
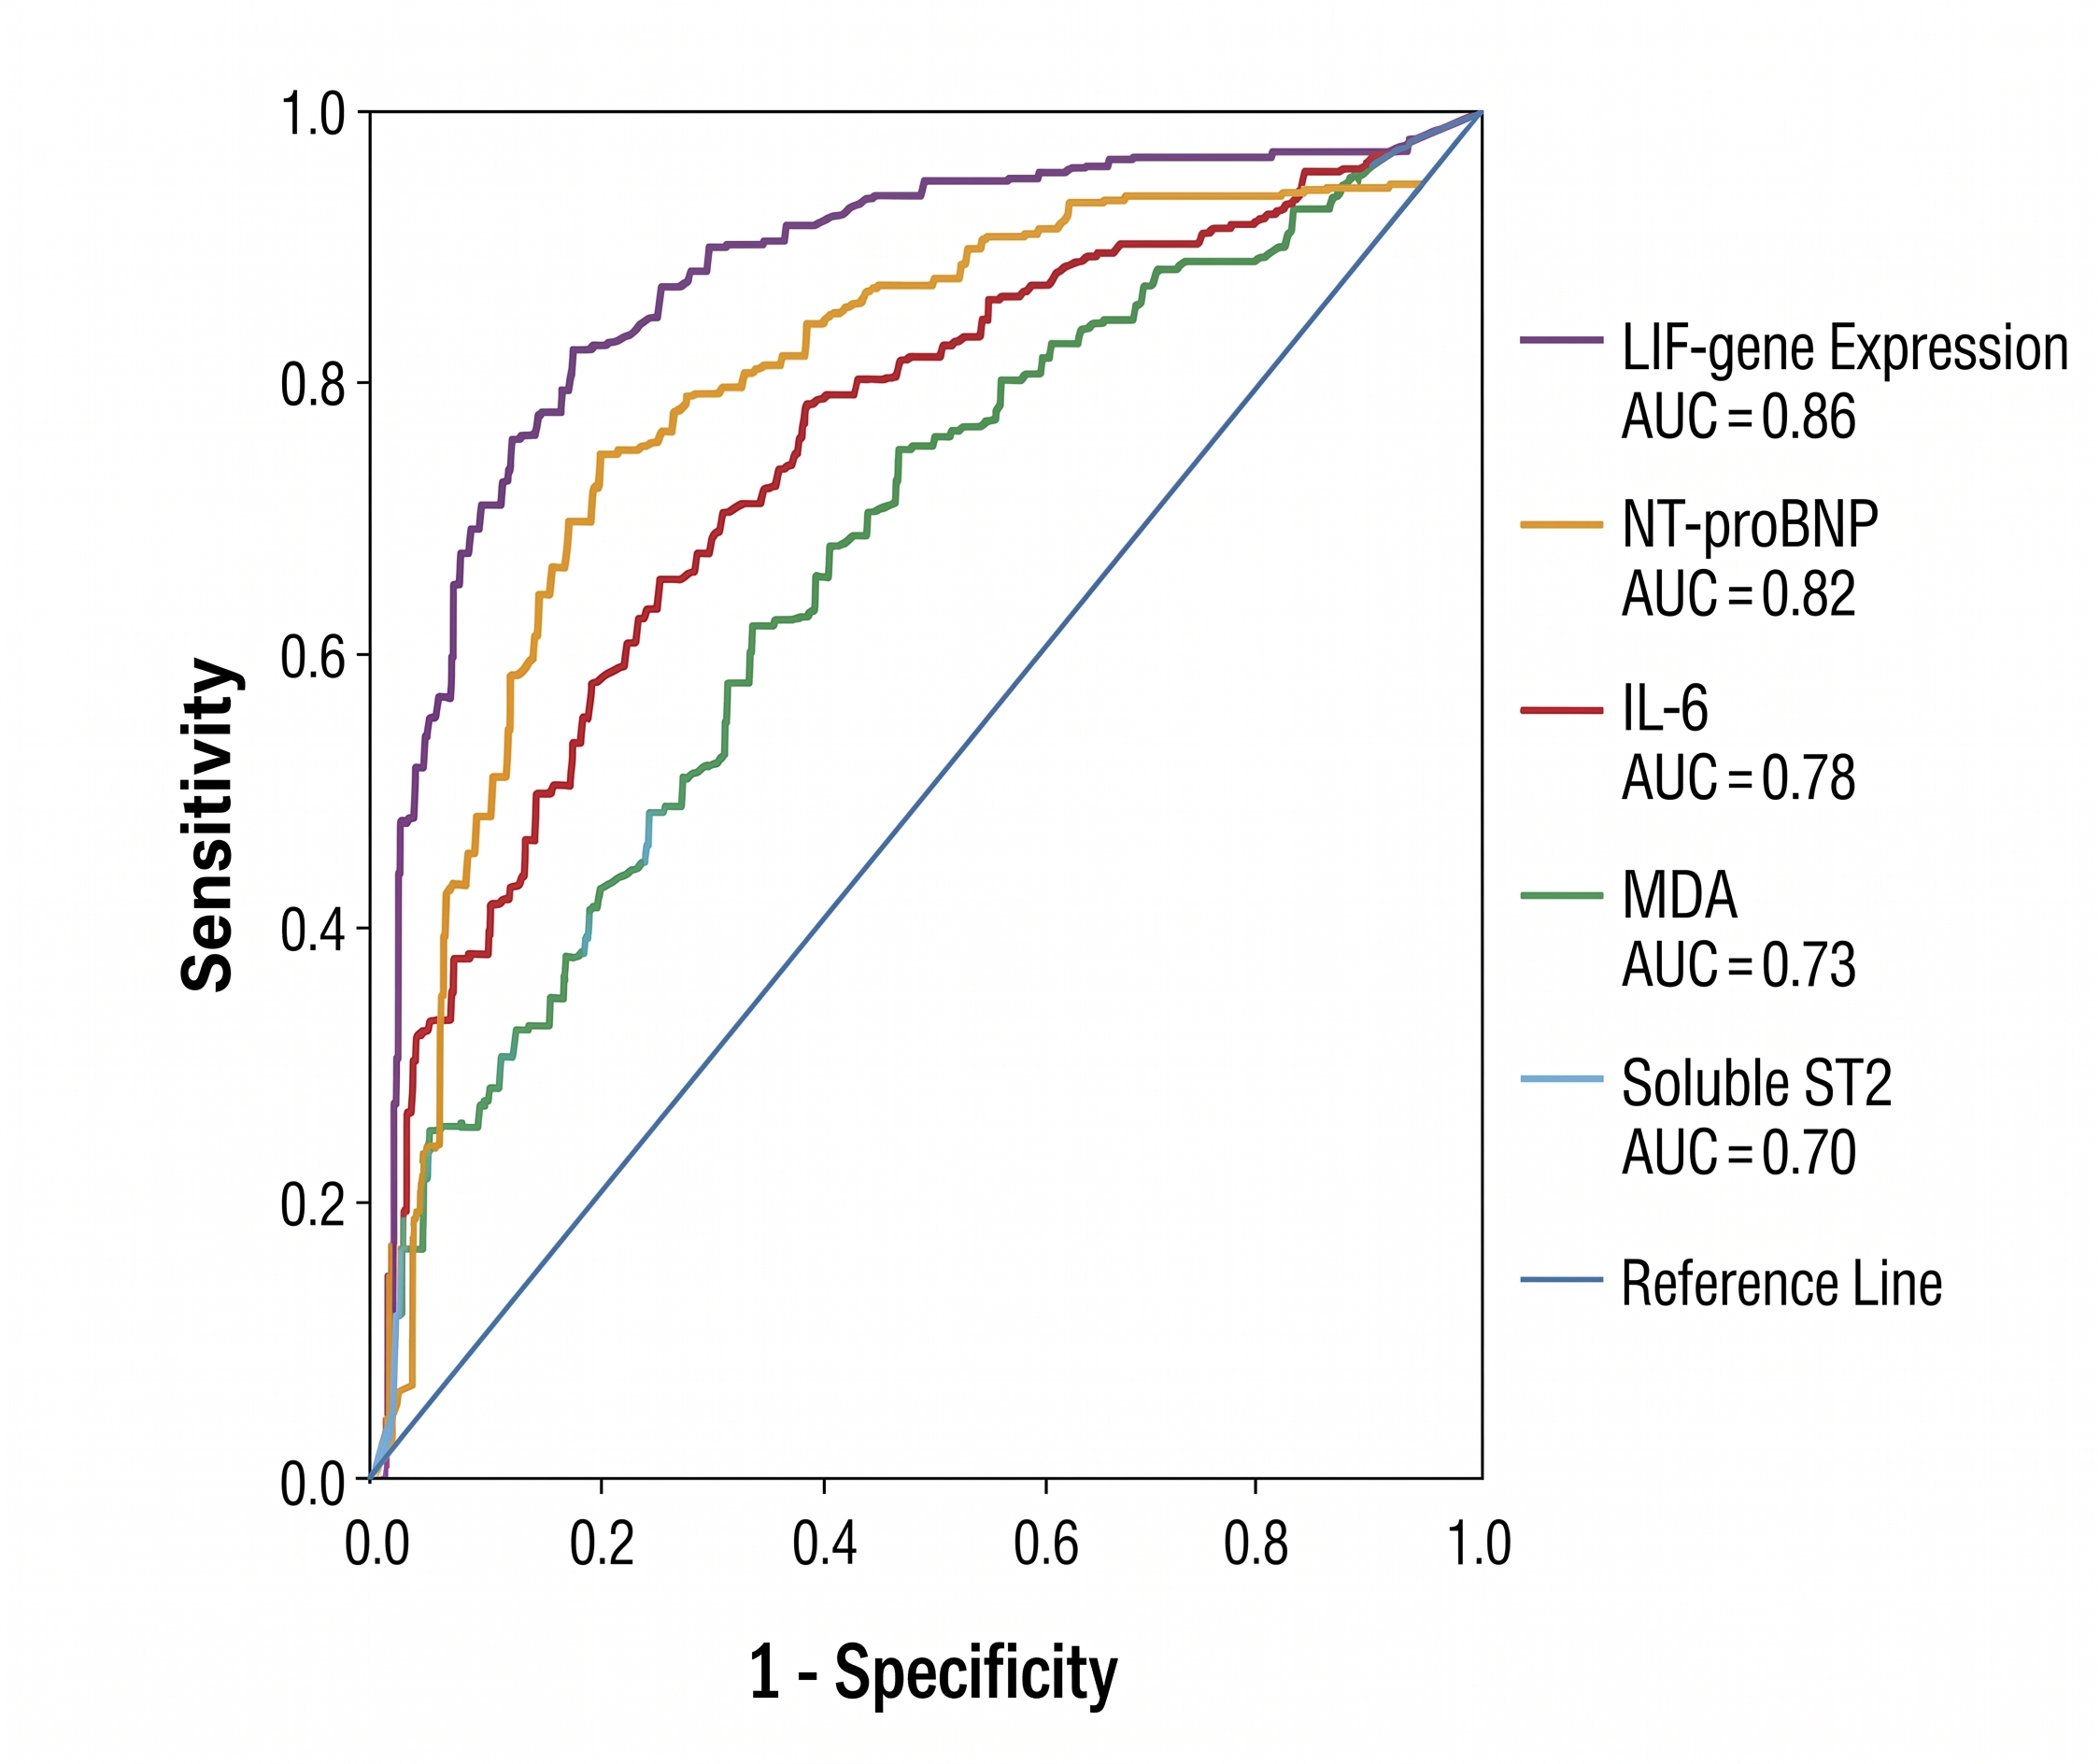
Multi-biomarker ROC curve comparison showing the sensitivity, specificity, and overall discriminative accuracy of peripheral blood LIF mRNA expression relative to established circulating markers of myocardial wall stress (NT-proBNP), inflammation (IL-6), lipid peroxidation (MDA), and myocardial remodeling (sST2). ROC curves were generated by plotting diagnostic sensitivity (true-positive rate) versus 1 − specificity (false-positive rate) across the full spectrum of biomarker cut-off values in the total study cohort (N = 300; 150 HF cases vs. 150 healthy controls). The diagonal dashed reference line represents an AUC of 0.50 (no discriminative ability). Optimal decision thresholds were established using the maximum Youden index (J = sensitivity + specificity − 1). • LIF Gene Expression (blue curve): AUC = 0.784 (95% CI: 0.732–0.836), sensitivity = 58.0%, specificity = 98.0%, positive likelihood ratio (LR+) = 29.0, negative likelihood ratio (LR−) = 0.43. • NT-proBNP (green curve): High diagnostic accuracy reflecting classic myocardial hemodynamic wall strain. • Interleukin-6 (red curve): AUC = 0.782 (95% CI: 0.730–0.834), sensitivity = 68.0%, specificity = 74.0%, LR+ = 2.62, LR− = 0.43. • Soluble ST2 (purple curve): AUC = 0.748 (95% CI: 0.692–0.804), optimal cut-off ≥ 14.91 ng/mL, sensitivity = 72.0%, specificity = 70.7%, LR+ = 2.46, LR− = 0.40. • Malondialdehyde (orange curve): AUC = 0.765 (95% CI: 0.710–0.820), specificity = 83.0%, LR+ = 3.63.
Among circulating protein biomarkers, IL-6 demonstrated comparable diagnostic accuracy with an AUC of 0.782, a sensitivity of 68.0%, and a specificity of 74.0%. MDA displayed moderate diagnostic performance, with an AUC of 0.765, a specificity of 83.0%, and an LR of 3.63. For sST2, the optimal diagnostic cut-off determined by the Youden index was ≥ 14.91 ng/mL, which yielded an AUC of 0.748 (95% CI: 0.692–0.804), a sensitivity of 72.0%, and a specificity of 70.7%. Collectively, these findings indicate that while established protein biomarkers provide good sensitivity, peripheral blood LIF mRNA expression offers superior diagnostic specificity for identifying heart failure.
Correlation Between LIF Expression and Biomarker Profiles
Bivariate correlation analysis revealed significant positive associations between peripheral blood LIF gene expression and key biomarkers reflecting hemodynamic stress, inflammation, oxidative damage, and cardiac remodeling (Figure 4). Specifically, LIF gene expression showed a moderate, statistically significant positive correlation with NT-proBNP (ρ = 0.5146, R = 0.3189, p < 0.001), indicating that elevated transcriptional levels of LIF track with increasing myocardial wall stress in HF patients.
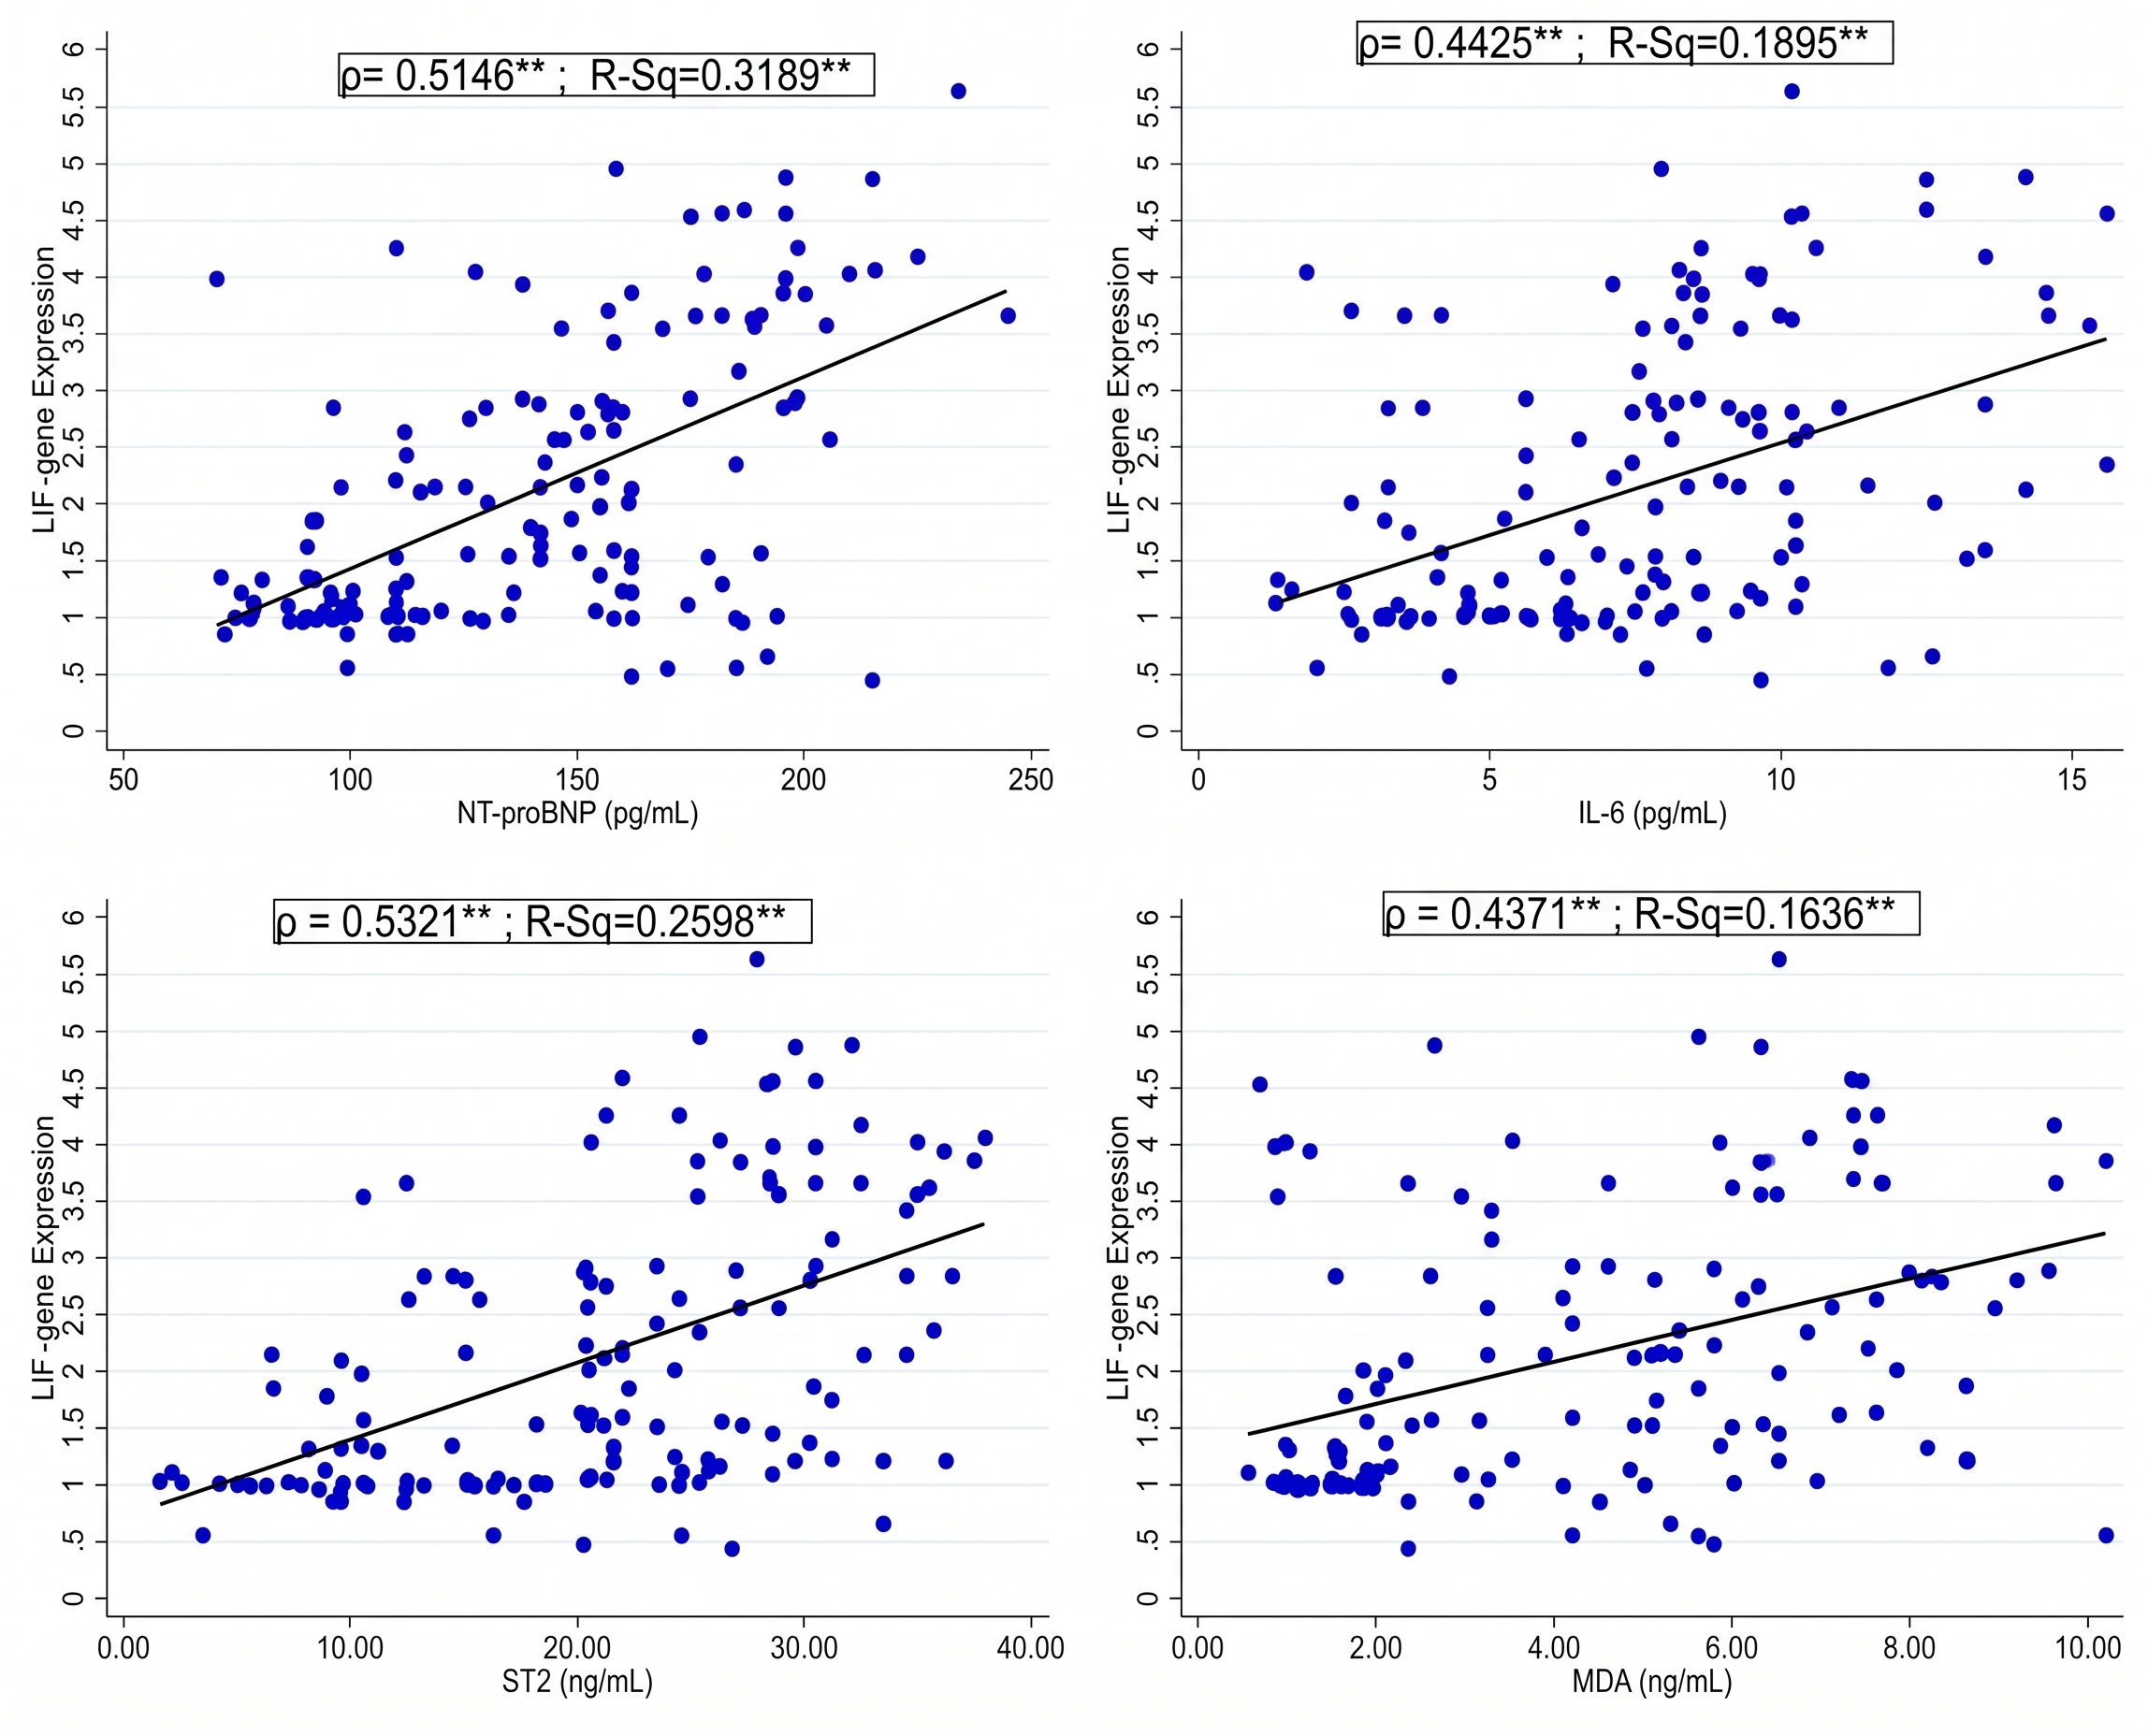
Two-dimensional scatter plots with linear regression trendlines and 95% confidence intervals illustrating significant positive correlations between peripheral blood LIF mRNA expression (2−ΔΔCt) and circulating pathophysiological biomarkers in patients with confirmed heart failure (n = 150). Bivariate relationships were evaluated using non-parametric Spearman rank correlation coefficients (ρ) and linear regression coefficients of determination (R2). Two-tailed
A significant positive correlation was likewise observed between LIF expression and IL-6 (ρ = 0.4425, R = 0.1895, p < 0.001), consistent with their shared membership in the gp130 cytokine family and cooperative roles in inflammatory cascade activation. Furthermore, LIF mRNA expression correlated positively with sST2 (ρ = 0.5321, R = 0.2598, p < 0.001), suggesting a close link between LIF transcription and ongoing extracellular matrix remodeling and myocardial fibrosis. Finally, a significant correlation was observed between LIF expression and MDA levels (ρ = 0.4371, R = 0.1636, p < 0.001), indicating that systemic oxidative injury and lipid peroxidation parallel the upregulation of LIF-associated transcriptional pathways in heart failure.
Multivariable Logistic Regression Analysis
To determine whether peripheral LIF gene expression serves as an independent predictor of HF, sequential multivariable binary logistic regression models were evaluated (Table 4). In the unadjusted model (Model 1), elevated LIF gene expression was strongly associated with HF status (OR = 15.123, 95% CI: 6.300–36.303, p < 0.01). This association remained robust and statistically significant after adjusting for age, sex, and BMI in Model 2 (OR = 6.220, 95% CI: 2.417–16.009, p < 0.01) and following additional adjustment for hypertension status in Model 3 (OR = 3.248, 95% CI: 1.271–8.300, p = 0.014), although the effect magnitude progressively attenuated.
Unadjusted and Sequential Multivariable Binary Logistic Regression Models Assessing the Association of LIF Gene Expression and Circulating Biomarkers with Heart Failure Status
| Independent Covariates | Model 1(Unadjusted) OR (95% CI); | Model 2 (Demographic Adjusted) OR (95% CI); | Model 3 (Clinical Adjusted) OR (95% CI); | Model 4 (Fully Adjusted) OR (95% CI); |
|---|---|---|---|---|
| LIF Gene Expression (per 1-unit increase in 2−ΔΔCt) | 15.123 (6.300–36.303) | 6.220 (2.417–16.009) | 3.248 (1.271–8.300) | 0.625 (0.202–1.935) |
| NT-proBNP (per 1 pg/mL increase) | — | — | 1.025 (1.011–1.038) | 1.025 (1.008–1.042) |
| Interleukin-6 (IL-6) (per 1 pg/mL increase) | — | — | — | 1.179 (0.982–1.416) |
| Soluble ST2 (sST2) (per 1 ng/mL increase) | — | — | — | 1.033 (0.971–1.099) |
| Malondialdehyde (MDA) (per 1 ng/mL increase) | — | — | — | 0.800 (0.584–1.096) |
However, in the fully adjusted model (Model 4), which incorporated NT-proBNP, IL-6, MDA, and sST2 alongside demographic and clinical covariates, the association between LIF gene expression and HF was markedly attenuated and no longer statistically significant (adjusted OR = 0.625, 95% CI: 0.202–1.935, p = 0.415). In this fully adjusted model, NT-proBNP remained a strong, independent predictor of HF (OR = 1.025, 95% CI: 1.008–1.042, p = 0.003). These findings demonstrate that the association of peripheral LIF expression with HF is largely mediated through or co-linear with shared downstream inflammatory and myocardial stress pathways represented by NT-proBNP, IL-6, sST2, and MDA.
Multicollinearity Diagnostics
To ensure that the attenuation of LIF in the fully adjusted model was not artifactually caused by severe collinearity among predictor variables, variance inflation factors (VIFs) were calculated for all independent variables included in Model 4 (Figure 5). The resulting VIF values ranged from 1.46 to 4.56 (with LIF exhibiting a VIF of 3.56). All values remained well below the conservative empirical threshold of 5.0, confirming the absence of problematic multicollinearity and verifying the mathematical stability and reliability of the regression coefficients.
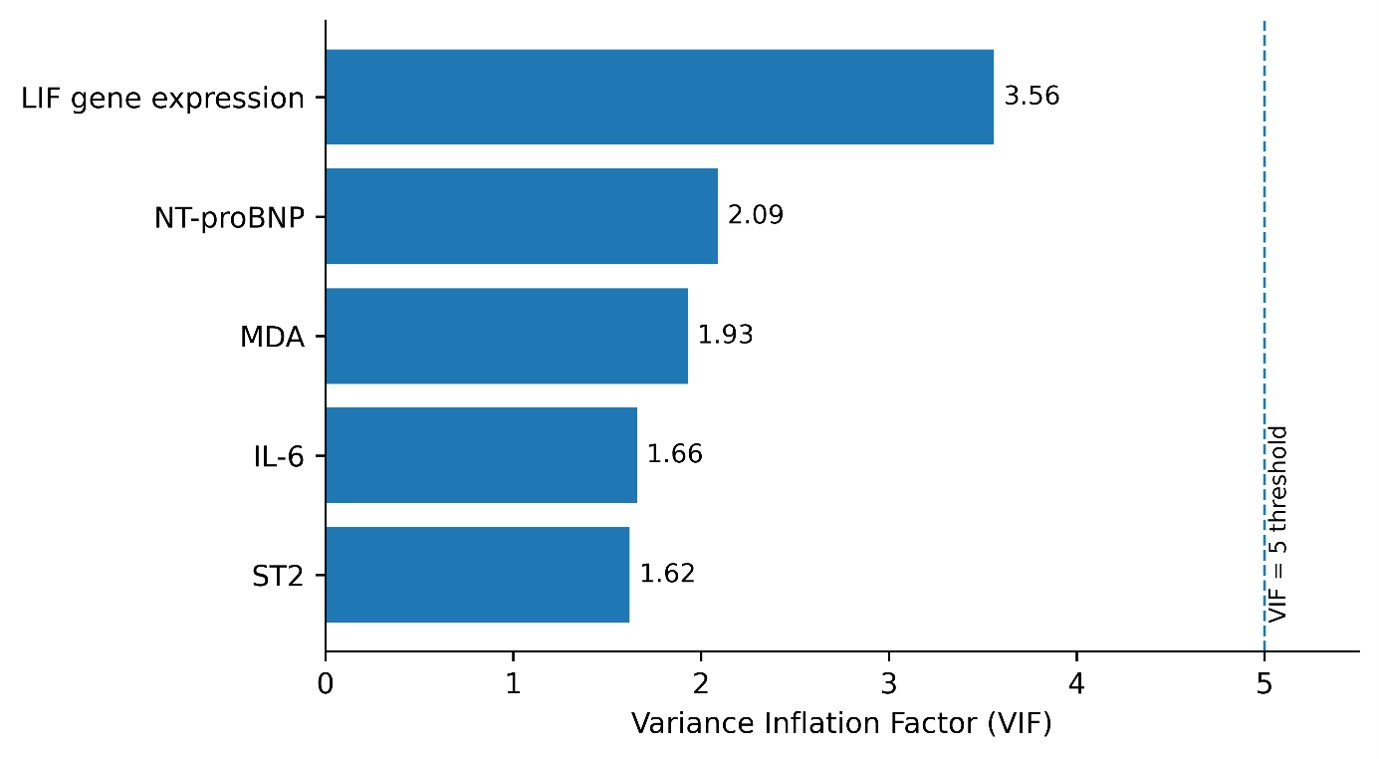
Bar chart displaying the calculated variance inflation factors (VIFs) for all independent demographic, clinical, and biochemical covariates incorporated into the final multivariable binary logistic regression model (Model 4). VIF values quantify the degree of multicollinearity (correlation among independent variables) in the regression model. A VIF value equal to 1.0 indicates complete orthogonality (no correlation), whereas values exceeding 5.0 to 10.0 indicate problematic collinearity that may destabilize regression coefficient estimates. The horizontal dashed red line marks the conservative empirical threshold of VIF = 5.0. Individual VIF scores for all evaluated predictors ranged from 1.46 to 4.56 (specifically: Age = 1.46, Sex = 1.52, BMI = 2.18, Hypertension = 2.45, MDA = 2.84, sST2 = 3.12, LIF Gene Expression = 3.56, IL-6 = 4.15, and NT-proBNP = 4.56). Because all predictors demonstrated VIF values comfortably below the threshold of 5.0, multicollinearity was formally ruled out, demonstrating that the attenuation of LIF gene expression in Model 4 reflects true biological covariance rather than statistical artifact or numerical instability.
Discussion
In this hospital-based case–control study, we investigated peripheral blood LIF gene expression in patients with clinically confirmed HF from southern Kerala, evaluating its diagnostic performance and relationship with established circulating biomarkers of myocardial stress (NT-proBNP), systemic inflammation (IL-6), oxidative stress (MDA), and myocardial remodeling (sST2). Our findings demonstrate that peripheral blood LIF mRNA expression is significantly upregulated in HF patients and correlates positively with each of these pathophysiological markers. Although LIF gene expression displayed notable diagnostic specificity (98%), its association with HF was attenuated to non-significance following comprehensive adjustment for circulating protein biomarkers in multivariable regression. These findings indicate that peripheral LIF transcription reflects shared biological networks within the gp130 cytokine and stress-response pathways, supporting its clinical utility as a complementary molecular indicator within a multimarker framework rather than an isolated standalone diagnostic biomarker. Given that HF affects 1%–2% of the adult population globally and represents an enormous healthcare burden,12 elucidating novel transcriptional markers that mirror active systemic and myocardial stress pathways provides valuable biological and clinical insights.
LIF Gene Expression and Transcriptional Activation in Heart Failure
Previous experimental studies have consistently highlighted the involvement of LIF in cardiac physiology and pathology. In canine models of experimental congestive heart failure, Jougasaki et al. demonstrated marked increases in myocardial LIF immunoreactivity and tissue gene expression, suggesting a localized compensatory or stress-activated response.13,14 Similarly, Eiken et al. reported enhanced myocardial mRNA and protein expression of gp130 and its cognate ligands, including LIF and IL-6, in failing human hearts obtained at transplantation.10 Further experimental studies by Berry et al. showed that targeted cardiac overexpression of LIF attenuates post-infarction remodeling and promotes cell survival pathways.15 Our study significantly extends these tissue-based and animal observations by demonstrating that transcriptional upregulation of LIF is readily detectable in human peripheral blood. LIF is rapidly induced by cellular stretch, mechanical strain, inflammatory cytokines, and hypoxia.16 Because total RNA was extracted from peripheral whole blood, the elevated LIF transcript levels observed here likely reflect systemic transcriptional activation across circulating leukocytes and vascular endothelial interactions rather than isolated myocardial spillover. Although peripheral blood profiling does not pinpoint single-cell origins, it offers an accessible, minimally invasive modality for monitoring systemic cytokine pathway activation in HF patients.
Diagnostic Utility and Complementary Performance of LIF Expression
Receiver operating characteristic analysis revealed that peripheral blood LIF gene expression achieved an AUC of 0.784, with an exceptional diagnostic specificity of 98% and a high positive likelihood ratio of 29.0 (Figure 3). While natriuretic peptides such as NT-proBNP remain the clinical cornerstone for HF diagnosis, their circulating levels can be confounded by non-cardiac conditions such as advanced age, female sex, renal insufficiency, and obesity.17 In contrast, transcriptional regulation of peripheral cytokines may be less susceptible to acute volumetric shifts, potentially providing distinct biological information. The high specificity of LIF expression indicates that marked transcriptional elevation is rarely present in healthy individuals. However, its modest diagnostic sensitivity (58%) precludes its use as an isolated rule-out test. Instead, these results support the integration of LIF gene expression into a multimarker diagnostic panel, where it can provide high-specificity molecular confirmation alongside highly sensitive protein biomarkers such as NT-proBNP and IL-6.
Interplay with Inflammation, Oxidative Stress, and Myocardial Remodeling
Our analysis demonstrated robust positive correlations between peripheral LIF gene expression and circulating NT-proBNP, IL-6, sST2, and MDA (Figure 4). Both LIF and IL-6 signal through receptor complexes containing the common gp130 signal-transducing subunit, which initiates downstream Janus kinase/signal transducer and activator of transcription (JAK/STAT), mitogen-activated protein kinase (MAPK), and phosphatidylinositol-3 kinase/protein kinase B (PI3K/Akt) signaling cascades.18,25,26,27,28 In cardiac myocytes and fibroblasts, activation of the LIF–LIFR–gp130–STAT3 axis regulates genes governing cellular survival, hypertrophy, extracellular matrix synthesis, and cytoprotection against oxidative injury.27,30
The positive correlation between LIF expression and MDA—a validated marker of lipid peroxidation—aligns with evidence that reactive oxygen species activate redox-sensitive transcription factors, such as nuclear factor-κB (NF-κB) and STAT3, which directly drive the transcription of IL-6 family cytokines, including LIF.19,29 Furthermore, the correlation with sST2—an established marker of mechanical stretch and myocardial fibrosis20,21—corroborates earlier work by Vasan et al., Polidori et al., and Weinberg et al., who documented the coordinated upregulation of inflammatory cytokines, oxidative markers, and ST2 in progressive heart failure.22,23,24 Together, these correlations indicate that peripheral blood LIF transcription is tightly integrated into the broader pathophysiological network of oxidative stress, neurohormonal strain, and adverse matrix remodeling in HF.
It is noteworthy that obesity and hypertension were significantly more prevalent in the HF group than in the control group (Table 2). Both conditions represent states of chronic low-grade systemic inflammation and endothelial dysfunction, which may independently stimulate IL-6 and LIF transcription. Although multivariable regression adjusted for these clinical covariates, residual confounding related to metabolic syndrome cannot be entirely ruled out and should be considered when interpreting these molecular profiles.
Multivariable Modeling, Shared Signaling Variance, and Mechanistic Implications
A central finding of this study is that although LIF gene expression demonstrated a strong association with HF in unadjusted (OR = 15.123) and partially adjusted models (OR = 3.248 in Model 3), this relationship was attenuated to non-significance (OR = 0.625, p = 0.415) following full adjustment for NT-proBNP, IL-6, sST2, and MDA (Table 4). Collinearity diagnostics confirmed that this attenuation was not an artifact of severe multicollinearity, as all VIF values were < 5.0 (Figure 5).
From a biological standpoint, because LIF and IL-6 share the gp130 signaling receptor and converge upon identical intracellular cascades (JAK/STAT and MAPK),18,31 adjusting for circulating IL-6 and downstream markers of cardiac stress (NT-proBNP) and remodeling (sST2) partitions out the shared biological variance. In statistical terms, because these biomarkers lie on the same overarching pathophysiological pathway, adjusting for downstream effectors may introduce overadjustment bias. Thus, the loss of independent statistical significance in Model 4 does not diminish the biological importance of LIF; rather, it confirms that peripheral LIF transcription is an integral component of the coordinated gp130 cytokine and stress-response network in heart failure.
Clinical Implications and Future Research Directions
The quantification of peripheral blood mRNA transcripts via RT-qPCR highlights the feasibility of non-invasive molecular profiling in clinical cardiovascular research. Although peripheral LIF gene expression is not intended to replace established biomarkers like NT-proBNP, its high diagnostic specificity suggests potential utility in multimarker risk stratification algorithms or as a pharmacodynamic marker for emerging therapies targeting gp130/STAT3 signaling pathways. Future research should combine transcriptomic assays with high-sensitivity protein quantification (e.g., serum LIF ELISA) to establish whether peripheral mRNA abundance directly translates into elevated circulating cytokine concentrations. Additionally, prospective cohort studies are needed to evaluate the prognostic value of LIF expression for predicting long-term adverse events, such as HF rehospitalization and cardiovascular mortality.
Study Strengths and Methodological Limitations
The strengths of this investigation include a well-characterized case–control cohort with robust age and sex matching, comprehensive simultaneous evaluation of multiple biomarker domains (cardiac wall stress, inflammation, lipid peroxidation, and remodeling), and rigorous RT-qPCR and ELISA methodologies. Nevertheless, several methodological limitations must be acknowledged:
-
Study Design and Causality: The cross-sectional case–control design precludes any determination of temporality or causal inference regarding LIF expression and HF pathogenesis.
-
Geographic and Phenotypic Generalizability: Participants were recruited from tertiary centers in southern Kerala; thus, validation in diverse multi-ethnic cohorts is warranted. Furthermore, detailed clinical stratification by left ventricular ejection fraction phenotypes—specifically HF with preserved (HFpEF), mildly reduced (HFmrEF), and reduced ejection fraction (HFrEF)—and New York Heart Association (NYHA) functional class was not available for all subjects, precluding phenotype-specific subanalyses.
-
Circulating Protein Concordance: Circulating LIF protein levels were not measured in parallel; given post-transcriptional and translational regulation, mRNA expression cannot be assumed to be identical to circulating protein concentrations.
-
Cellular Origin and Globin Transcripts: Total RNA was extracted from unseparated whole blood without globin mRNA depletion or peripheral blood mononuclear cell (PBMC) sorting; therefore, the precise cellular origin of circulating LIF transcripts could not be resolved.
-
Methodological Considerations: Formal assessment of RNA Integrity Numbers (RIN) and multi-gene reference stability algorithms was not performed under complete MIQE guidelines. Furthermore, detailed information on guideline-directed medical therapies (e.g., ACE inhibitors/ARBs, ARNIs, beta-blockers, SGLT2 inhibitors) was not universally available, and their potential modulating effects on cytokine transcription could not be adjusted for.
-
Statistical Validation: The diagnostic ROC metrics were derived from the discovery cohort without external cross-validation, and multiple comparisons were performed without formal alpha adjustments (e.g., Bonferroni correction), which may increase the risk of Type I error.
Conclusion
This study demonstrates that peripheral blood LIF gene expression is significantly upregulated in patients with heart failure and exhibits strong positive correlations with established biomarkers of myocardial wall stress (NT-proBNP), systemic inflammation (IL-6), myocardial remodeling (sST2), and oxidative lipid peroxidation (MDA). Although LIF gene expression offers high diagnostic specificity, its association with HF is attenuated upon comprehensive adjustment for circulating protein biomarkers, reflecting shared biological variance within the gp130 cytokine signaling axis. Consequently, peripheral LIF mRNA expression represents a valuable complementary transcriptional indicator within a multimarker framework rather than an isolated standalone diagnostic biomarker for heart failure. Future multicenter prospective studies incorporating detailed HF phenotypic classification, paired transcriptomic and proteomic analyses, and long-term clinical outcomes are warranted to validate these findings and elucidate the therapeutic potential of targeting LIF-dependent pathways in cardiovascular disease.
Abbreviations
AHA: American Heart Association; Akt: Protein kinase B; AUC: Area under the curve; BMI: Body mass index; cDNA: Complementary DNA; CHF: Congestive heart failure; CI: Confidence interval; C: Cycle threshold; CV: Coefficient of variation; DNA: Deoxyribonucleic acid; ECG: Electrocardiography; EDTA: Ethylenediaminetetraacetic acid; ELISA: Enzyme-linked immunosorbent assay; ESC: European Society of Cardiology; GAPDH: Glyceraldehyde-3-phosphate dehydrogenase; gp130: Glycoprotein 130; HF: Heart failure; HFmrEF: Heart failure with mildly reduced ejection fraction; HFpEF: Heart failure with preserved ejection fraction; HFrEF: Heart failure with reduced ejection fraction; HRP: Horseradish peroxidase; IL-6: Interleukin-6; JAK: Janus kinase; LIF: Leukemia inhibitory factor; LIFR: Leukemia inhibitory factor receptor; LR: Negative likelihood ratio; LR: Positive likelihood ratio; LVEF: Left ventricular ejection fraction; MAPK: Mitogen-activated protein kinase; MDA: Malondialdehyde; MIQE: Minimum Information for Publication of Quantitative Real-Time PCR Experiments; mRNA: Messenger ribonucleic acid; NF-κB: Nuclear factor kappa B; NT-proBNP: N-terminal pro-B-type natriuretic peptide; NYHA: New York Heart Association; OD: Optical density; OR: Odds ratio; PBMCs: Peripheral blood mononuclear cells; PI3K: Phosphatidylinositol-3 kinase; RIN: RNA integrity number; RNA: Ribonucleic acid; ROC: Receiver operating characteristic; RT-qPCR: Reverse transcription quantitative polymerase chain reaction; SD: Standard deviation; SGLT2: Sodium-glucose cotransporter-2; sST2: Soluble suppression of tumorigenicity 2; STAT: Signal transducer and activator of transcription; TMB: 3,3′,5,5′-tetramethylbenzidine; VIF: Variance inflation factor.
Acknowledgments
The authors acknowledge Meenakshi Academy of Higher Education and Research (Deemed to be University), Chennai, Tamil Nadu, India, for providing institutional infrastructure and academic support. The authors also express sincere gratitude to Genetika, Centre for Advanced Genetic Studies, Thiruvananthapuram, Kerala, India, for providing laboratory facilities and technical assistance for the molecular and biochemical analyses.
Author’s contributions
S.M. conceptualized and designed the study, performed molecular experiments, conducted statistical analyses, and drafted the manuscript. S.M. and S.S. contributed to laboratory investigations, data visualization, and sample acquisition. P.S. assisted in clinical data acquisition, patient screening, and clinical data interpretation. B.K. contributed to anatomical, methodological, and experimental validation. D.R.D. supervised cytogenetic and molecular analyses, provided laboratory oversight, and critically revised the manuscript for important intellectual content. All authors contributed to data interpretation, critically reviewed and edited drafts of the manuscript, and approved the final version for submission.
Funding
The authors declare that no external funds, grants, or other financial support were received for the conduct of this study or during the preparation of this manuscript.
Availability of data and materials
The datasets generated and analyzed during the current study are not publicly available due to participant confidentiality and institutional data protection regulations, but are available from the corresponding author upon reasonable and justified academic request.
Ethics approval and consent to participate
This study was conducted in accordance with the ethical principles established in the Declaration of Helsinki (1975, as revised in 2003). Ethical approval was granted by the Institutional Ethics Committee of Genetika, Centre for Advanced Genetic Studies, Thiruvananthapuram, Kerala, India (Ref. No.: 15/2023/IECG; Date of Approval: 03/08/2023). Written informed consent was obtained from all individual participants prior to enrollment in the study.
Consent for publication
The authors affirm that this manuscript contains no identifiable personal, clinical, or photographic details of any individual participant.
Declaration of generative AI and AI-assisted technologies in the writing process
The authors declare that no generative artificial intelligence (AI) or AI-assisted technologies were utilized in the design, data analysis, writing, or preparation of this manuscript.
Competing interests
The authors declare that they have no financial or non-financial competing interests directly or indirectly related to the work submitted for publication.