


Chloroquine Enhances Doxorubicin Cytotoxicity in HepG2 Hepatocellular Carcinoma Cells: A Chou–Talalay Analysis under Normoxia and CoCl2-Induced Hypoxia
- VNUHCM-US Stem Cell Institute, University of Science, Vietnam National University Ho Chi Minh City, Ho Chi Minh City, Vietnam
Abstract
Background: Hepatocellular carcinoma (HCC) remains a major cause of cancer-related mortality globally. The therapeutic efficacy of doxorubicin (DOX) in HCC is frequently compromised by chemoresistance mediated by adaptive cellular mechanisms within the hypoxic tumor microenvironment. Because hypoxia promotes cytoprotective autophagy to sustain cancer cell survival, we investigated whether pharmacological autophagy inhibition with chloroquine (CQ) enhances DOX cytotoxicity in HepG2 human HCC cells under normoxic and cobalt chloride (CoCl2)-induced hypoxic conditions.
Methods: HepG2 cells were cultured under normoxia or chemically induced hypoxia (100 µM CoCl2 for 72 h). Cellular viability was assessed via the Alamar Blue assay, and pharmacological interactions were evaluated using the median-effect equation and combination index (CI) theorem of Chou–Talalay. Autophagic alterations were examined through sequential live-cell Acridine Orange (AO) and fixed-cell LC3A/B immunofluorescence microscopy, and cell death modes were quantified by Annexin V/7-aminoactinomycin D (7-AAD) flow cytometry. In a previously validated model (Dao Minh, Pham Anh, & Nguyen, 2025), CoCl2 treatment significantly upregulated hypoxia-inducible factor 1-alpha (HIF-1α) downstream target genes VEGF and GLUT1 (p < 0.05), confirming a functional hypoxic transcriptional response.
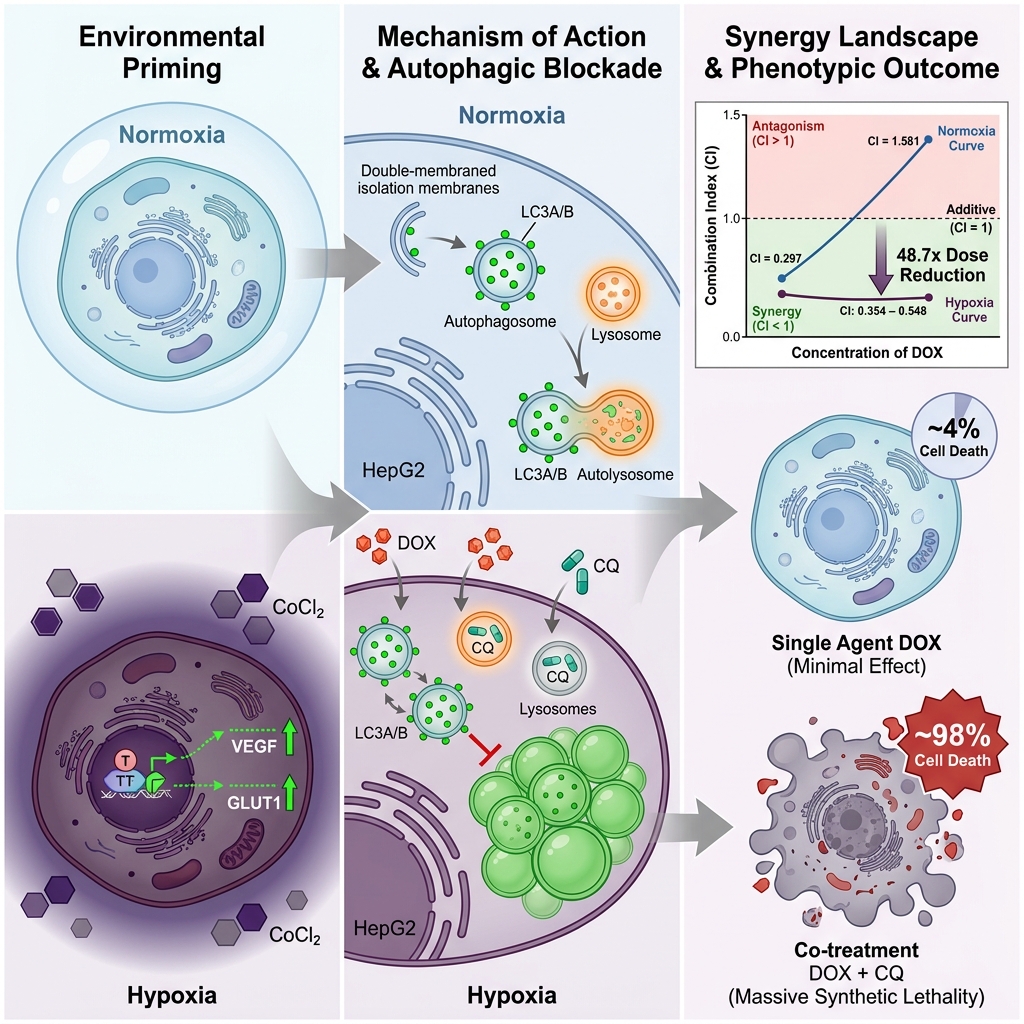
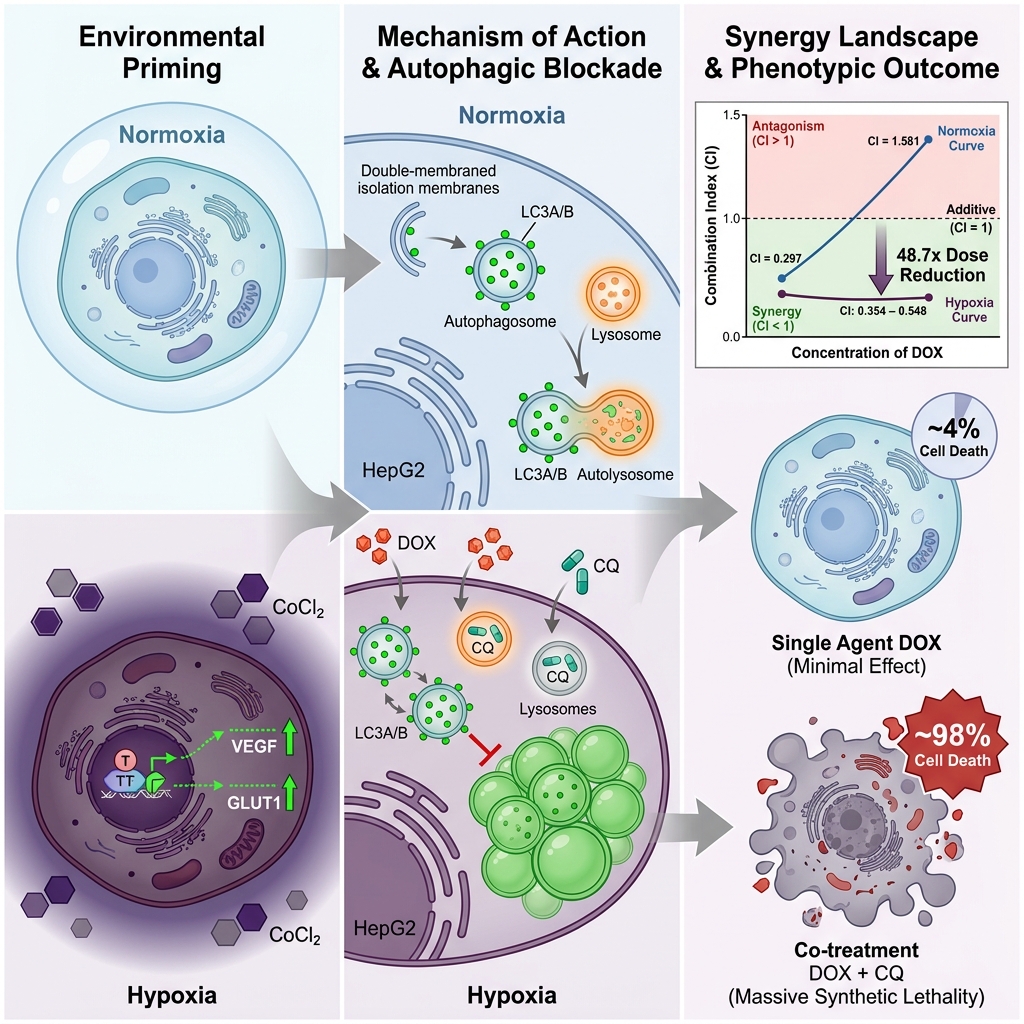
Results: Treatment with CQ (25 µM) induced substantial accumulation of LC3-positive autophagosomes accompanied by a marked reduction in AO-labeled acidic vesicular organelles, a hallmark phenotype indicative of impaired autophagosome–lysosome fusion and defective autolysosome formation. Single-agent DOX elicited modest cytotoxicity across both oxygenation states (~3.4–4.5% cell death), whereas CQ co-treatment markedly elevated total cell death (>95%). Under normoxia, the two-agent DOX–CQ combination index increased progressively with DOX concentration, shifting from synergism at low concentrations (CI = 0.30 at 0.031 µM DOX) to additivity and antagonism at higher concentrations (CI = 1.58 at 0.5 µM DOX). Conversely, under CoCl2-induced hypoxia, the three-component combination index remained consistently synergistic across the entire tested DOX range (CI = 0.35–0.55), with a projected DOX dose-reduction index (DRI) of up to 48.7-fold. Because CoCl2 was incorporated as a third component in the hypoxic model, this index represents a three-drug interaction and is not directly numerically equivalent to the normoxic two-agent index.
Conclusions: Hypoxic stress adaptation establishes a vulnerable state in HepG2 cells that is highly sensitive to CQ-mediated lysosomal autophagy inhibition. These findings indicate that targeting protective autophagy in hypoxic niches represents a promising adjunctive strategy to overcome chemoresistance and lower required anthracycline doses in HCC. Given the exploratory nature of this single-cell-line, CoCl2-based model, subsequent validation across diverse HCC cell lines, physical hypoxia chambers, biochemical autophagic flux assays, primary hepatocyte controls, and in vivo models is warranted.
Graphical abstract
Introduction
Hepatocellular carcinoma (HCC), representing the vast majority of primary liver malignancies, remains a formidable global health challenge and ranks among the leading causes of cancer-related mortality worldwide. The clinical burden of HCC is particularly severe in regions with high endemic prevalence rates of hepatitis B virus (HBV) and hepatitis C virus (HCV), notably Southeast Asia and sub-Saharan Africa. According to GLOBOCAN 2022 statistics, liver cancer represents the third leading cause of cancer mortality globally, accounting for approximately 866,000 incident cases and 759,000 deaths annually1. Vietnam bears a disproportionate burden of this regional disease pattern, with liver cancer consistently ranking among the leading causes of cancer death nationwide, predominantly driven by chronic viral hepatitis infection. Because a substantial proportion of patients are diagnosed at advanced stages—when curative modalities such as surgical resection, local ablation, or orthotopic liver transplantation are no longer feasible—effective systemic pharmacotherapies, particularly those capable of circumventing therapeutic resistance, are urgently required.
Doxorubicin (DOX), an anthracycline antineoplastic antibiotic, has long served as a backbone chemotherapeutic agent for HCC, primarily acting through topoisomerase II inhibition and DNA intercalation to trigger double-strand DNA breaks and apoptotic cell death2. Nevertheless, the clinical utility of DOX monotherapy is severely constrained by intrinsic and acquired multidrug resistance, alongside cumulative dose-limiting cardiotoxicity3,4. A key cytoprotective mechanism mediating chemoresistance is macroautophagy (hereafter termed autophagy), a tightly regulated evolutionary catabolic process wherein cytoplasmic constituents, damaged organelles, and protein aggregates are sequestered within double-membrane autophagosomes and delivered to lysosomes for degradation and recycling. In malignant cells exposed to chemotherapeutic stress, autophagy frequently serves as an adaptive survival mechanism that replenishes metabolic intermediates and clears reactive oxygen species (ROS)-generating damaged mitochondria, thereby attenuating pro-apoptotic signaling cascades and facilitating chemoresistance4,5.
The tumor microenvironment (TME) is a fundamental driver of HCC progression, metabolic remodeling, and therapeutic recalcitrance. Intratumoral hypoxia, a ubiquitous physiological hallmark of rapidly growing solid tumors, stabilizes and activates hypoxia-inducible factor 1-alpha (HIF-1α), a master transcription factor orchestrating the expression of gene networks governing angiogenesis, glycolytic metabolism, and cytoprotective autophagy6. In experimental in vitro models, cobalt chloride (CoCl) is widely utilized as a hypoxia-mimetic agent; it displaces ferrous iron (Fe) and inhibits prolyl hydroxylase domain-containing enzymes (PHDs), thereby preventing the oxygen-dependent ubiquitin-proteasomal degradation of HIF-1α under normoxic conditions and activating downstream hypoxia-responsive gene programs7. Hypoxia-induced autophagy has been implicated as a critical contributor to anthracycline resistance in HCC cells, operating alongside HIF-1α-mediated upregulation of ATP-binding cassette (ABC) efflux transporters and diminished baseline ROS generation4,8.
Chloroquine (CQ), a clinical 4-aminoquinoline antimalarial and antirheumatic agent, acts as a functional late-stage autophagy inhibitor. As a lysosomotropic weak base, CQ diffuses passively into acidic organelles, becomes protonated and trapped within lysosomes, and neutralizes intra-lysosomal pH. This impairment impairs autophagosome–lysosome fusion and inhibits acid hydrolase catalytic activity, resulting in the intracellular accumulation of undigested autophagosomes and cellular debris, ultimately shifting the cellular equilibrium from autophagy-dependent survival toward cell death. Extensive preclinical evidence indicates that pharmacological autophagy blockade with CQ or its derivative hydroxychloroquine can sensitize refractory malignant cells, including HCC, to conventional cytotoxic drugs such as DOX and cisplatin9,10,11.
The primary objective of the present study was to quantitatively compare the pharmacological interaction profiles between DOX and CQ under normoxic versus CoCl-induced hypoxic conditions in human HepG2 HCC cells. Utilizing the rigorous median-effect principle and Combination Index (CI) theorem established by Chou and Talalay12, we evaluated whether hypoxia modifies both the magnitude and dose stability of drug synergism. A prior study from our group established that CoCl-induced hypoxia promotes DOX chemoresistance in this HepG2 model13. Building on those findings, this work integrates CI and Dose Reduction Index (DRI) modeling with autophagy-associated morphological imaging and flow cytometric apoptosis assays to determine whether hypoxia-induced adaptive autophagy creates a distinct targetable vulnerability that alters combination pharmacology.
Materials and MethodThe overall experimental workflow and study design are schematically illustrated in Supplementary Figure S0.
Cell Culture and Reagents
The human hepatocellular carcinoma cell line HepG2 was acquired from the American Type Culture Collection (ATCC; Manassas, VA, USA; Cat. #HB-8065™). Cells were maintained at low passage numbers (passages 5–15). HepG2 cells were cultured in high-glucose Dulbecco’s Modified Eagle Medium (DMEM; Thermo Fisher Scientific, Waltham, MA, USA; Cat. #11965092) supplemented with 10% (v/v) heat-inactivated fetal bovine serum (FBS; Thermo Fisher Scientific; Cat. #26140079) and 1% (v/v) penicillin-streptomycin solution (HyClone Laboratories, Logan, UT, USA; Cat. #SV30010). Cultures were maintained at 37°C in a humidified incubator containing 5% CO and 95% air. All experimental assays were initiated when cultures reached 70–80% confluence, and routine PCR-based testing was conducted to confirm the absence of mycoplasma contamination.
Drug Preparation
Doxorubicin hydrochloride (DOX; Sigma-Aldrich, St. Louis, MO, USA; Cat. #D1515) was dissolved in sterile deionized water to yield a 1 mM stock solution. Chloroquine diphosphate (CQ; Sigma-Aldrich; Cat. #C6628), rapamycin (Sigma-Aldrich; Cat. #R0395), and cobalt(II) chloride hexahydrate (CoCl; TM Media, India) were dissolved in sterile dimethyl sulfoxide (DMSO; Sigma-Aldrich) to prepare 10 mM stock solutions. All stock solutions were divided into single-use aliquots and preserved at −20°C in the dark. Working concentrations were freshly prepared by serially diluting stock solutions into complete culture medium immediately prior to application. In all experimental conditions, the final vehicle (DMSO) concentration was maintained at ≤0.1% (v/v), a concentration validated in preliminary control assays to exert no detectable influence on cell viability or baseline apoptosis.
The fixed CQ working concentration of 25 µM was selected on the basis of preliminary dose-response cytotoxicity screening across a range of 0–400 µM under both normoxic and CoCl-induced hypoxic conditions (Supplementary Figure S4). At 25 µM, CQ exhibited minimal single-agent toxicity under normoxia while eliciting measurable growth inhibition under CoCl-induced hypoxia. Autophagy inhibition at this concentration was independently corroborated by the fluorescence microscopy experiments described below and aligns with established concentrations utilized in peer in vitro HCC autophagy inhibition studies9,14. Although therapeutic plasma CQ concentrations in patients typically reside in the low micromolar range (1–5 µM), CQ undergoes extensive lysosomal trapping wherein intracellular organellar concentrations can exceed extracellular levels by several orders of magnitude, making 25 µM a biologically and pharmacologically sound in vitro working concentration14.
Induction and Validation of Hypoxic Conditions
Chemical hypoxia was induced using CoCl, a well-characterized chemical hypoxia mimetic that blocks Fe/2-oxoglutarate-dependent PHDs, thereby stabilizing HIF-1α under normoxic oxygen levels and triggering downstream transcriptional programs7. Based on extensive dose- and time-optimization experiments, exposure to 100 µM CoCl for a total duration of 72 h was selected as the standardized hypoxic condition for all downstream drug interaction experiments, as this regimen robustly activated hypoxia-responsive genes while preserving sufficient cell viability for pharmacological combination testing (Supplementary Figure S1). This protocol aligns with standard CoCl concentrations and durations established in HCC literature7,8.
Hypoxic induction was validated at the transcriptional level via reverse transcription-quantitative PCR (RT-qPCR). The RT-qPCR data referenced herein were previously acquired, analyzed, and published as part of our initial characterization of this HepG2/CoCl experimental system13, and are referenced to confirm that the identical validated hypoxia-mimetic conditions were applied in the present study. In that work, HepG2 cells were exposed to 50 µM or 100 µM CoCl for 72 h, with vehicle-matched DMSO controls included across all plates. Total RNA was isolated using the easy-BLUE™ Total RNA Extraction Kit (iNtRON Biotechnology, Seongnam, Republic of Korea). One-step RT-qPCR was conducted using the Luna® Universal One-Step RT-qPCR Kit (New England Biolabs, Ipswich, MA, USA) on a real-time PCR detection system. Primer sequences (synthesized by Phusa Genomics, Ho Chi Minh City, Vietnam) designed using Primer-BLAST were as follows:
-
HIF-1α : Forward 5′-TGCTTGCCAAAAGAGGTGGA-3′, Reverse 5′-GGGGCCAGCAAAGTTAAAGC-3′ -
VEGF : Forward 5′-GGACATTGCTGTGCTTTGGG-3′, Reverse 5′-ATGGGCTGCTTCTTCCAACA-3′ -
GLUT1 : Forward 5′-CTGTCGTGTCGCTGTTTGTG-3′, Reverse 5′-AAAGATGGCCACGATGCTCA-3′ -
β-actin (reference gene): Forward 5′-GACTTAGTTGCGTTACACCCTTTCT-3′, Reverse 5′-GAACGGTGAAGGTGACAGCAGT-3′
Target transcript levels were normalized to β-actin and quantified using the comparative 2 method (n = 3). As documented in Dao Minh, Pham Anh, & Nguyen (2025), treatment with 100 µM CoCl for 72 h elicited statistically significant upregulation of VEGF and GLUT1 mRNA relative to untreated normoxic controls (p < 0.05). HIF-1α mRNA was modestly elevated but did not attain statistical significance, a finding fully consistent with the primary post-translational mechanism of CoCl-mediated PHD inhibition, wherein HIF-1α is stabilized at the protein level via degradation blockade without requiring transcriptional upregulation. Consequently, induction of the downstream transcriptional targets VEGF and GLUT1 serves as the functional indicator of hypoxic pathway activation in this cell model.
Cell Viability Assay
Cell viability was quantified using the resazurin-based Alamar Blue fluorometric assay (Invitrogen, Thermo Fisher Scientific; Cat. #DAL1025). HepG2 cells were seeded into 96-well culture plates at a density of 2,000 cells per well in 100 µL of complete growth medium and allowed to adhere for 24 h at 37°C. Following drug treatments, Alamar Blue reagent was added to each well at a final concentration of 10% (v/v) and incubated for 4 h at 37°C in the dark. Fluorescence emission intensity was recorded on a DTX880 multimode microplate reader (Beckman Coulter, Brea, CA, USA) with excitation at 560 nm and emission at 590 nm. The fraction of cells affected (Fa) was calculated as Fa = 1 − (% Cell Viability / 100).
Drug Combinations and Synergy Analysis
Two primary drug-treatment paradigms were investigated. Under chemically induced hypoxia, cells were pre-treated with 100 µM CoCl for 48 h to establish a stable hypoxic transcriptional state, followed by simultaneous co-treatment with DOX (ranging from 0.016 to 0.5 µM) and CQ (fixed at 25 µM) for an additional 24 h (cumulative CoCl exposure: 72 h; designated as the DCC combination). Under normoxia, cells were co-treated simultaneously with DOX (0.016–0.5 µM) and CQ (fixed at 25 µM) for 24 h (designated as the DOX:CQ combination). Because CoCl was incorporated into the cell culture medium as a hypoxia-mimicking experimental variable rather than as a therapeutic candidate, CI and DRI values calculated for the DCC group reflect the pharmacodynamic interaction within this three-component experimental model and should not be construed as clinical dose-reduction targets.
Single-agent and pairwise dose-response profiles utilized to fit median-effect reference curves (DOX alone, CQ alone, CoCl alone, CQ:CoCl, and DOX:CoCl) were generated using a 24 h CoCl pre-treatment protocol matching the dose-optimization assays in Supplementary Figure S4, rather than the 48 h pre-treatment plus 24 h co-treatment protocol (72 h total) utilized for the DCC combination and flow cytometry assays. This technical distinction in pre-incubation duration is noted for clarity in interpreting the pairwise reference curves.
Drug interaction dynamics were formally modeled according to the Chou–Talalay median-effect equation (Chou, 2010) using CompuSyn software (ComboSyn, Inc., Paramus, NJ, USA). The Combination Index (CI) was calculated to define the nature of the pharmacological interaction: CI < 1 denotes synergism; CI = 1 denotes an additive effect; and CI > 1 denotes antagonism. The Dose Reduction Index (DRI) was computed to define the theoretical fold-reduction in the concentration of each therapeutic agent required within the combination to achieve a given fraction affected (Fa) compared with the concentration required for single-agent monotherapy.
Apoptosis and Cell Death Assay by Flow Cytometry
Apoptotic and necrotic cell death fractions were quantitatively resolved using an Annexin V/7-AAD dual-staining apoptosis detection kit (BD Biosciences, San Jose, CA, USA). For hypoxic groups, HepG2 cells were pre-incubated with 100 µM CoCl for 48 h followed by the addition of DOX (62.5 nM) and/or CQ (25 µM) for an additional 24 h (total CoCl exposure: 72 h). DOX at 62.5 nM was selected as a standardized sub-IC concentration based on preliminary viability dose-response assays indicating a normoxic DOX IC of 250–500 nM in this cell line, placing 62.5 nM at approximately 12–25% of the IC. This sub-IC concentration was specifically chosen to evaluate resistance and sensitization mechanisms operating under conditions of partial cytotoxic pressure, reflecting physiological tumor niches where incomplete drug penetration occurs. For normoxic groups, cells were treated with DOX and/or CQ for 24 h without CoCl.
Following incubation, floating and adherent cells were harvested, washed twice with ice-cold phosphate-buffered saline (PBS), and resuspended in 1× Annexin V Binding Buffer. Cells were stained with allophycocyanin (APC)-conjugated Annexin V and peridinin-chlorophyll-protein (PerCP)-conjugated 7-AAD for 15 min at room temperature (25°C) in the dark. Flow cytometric acquisition was conducted on a BD FACS Melody™ cell sorter (BD Biosciences), recording a minimum of 10,000 gated singlet events per sample. Flow cytometric data were analyzed using FlowJo software (Tree Star Inc., Ashland, OR, USA; BD Biosciences). Quadrant gates were set to resolve four distinct subpopulations: viable cells (Annexin V/7-AAD), early apoptotic cells (Annexin V/7-AAD), late apoptotic or secondary necrotic cells (Annexin V/7-AAD), and primary necrotic cells (Annexin V/7-AAD). Total cell death was defined as the aggregate percentage of early apoptotic, late apoptotic, and necrotic populations.
Flow Cytometric Analysis of LC3 Expression
To establish baseline autophagic induction protocols and calibrate flow cytometric detection of microtubule-associated protein 1A/1B-light chain 3 (LC3), LC3 expression was evaluated by flow cytometry. HepG2 cells were seeded into 6-well plates at a density of 1 × 10 cells per well. After 24 h, cells were exposed to rapamycin (0, 1, 2, or 4 µM) for 24 h in a dose-calibration study to determine the lowest effective concentration yielding reproducible LC3 accumulation. Based on these assays, 1 µM rapamycin was selected as the positive control for autophagy induction in subsequent fluorescence microscopy (viability curve in Supplementary Figure S2; flow cytometric validation in Supplementary Figure S3, demonstrating a shift in LC3A/B positivity from 0.13% to 74.4%). Because 1 µM rapamycin yielded near-saturating LC3A/B positivity, higher concentrations (2 and 4 µM) provided no additional analytical resolution and were not evaluated further.
For staining, harvested cells were fixed with 4% paraformaldehyde for 15 min and permeabilized with 90% ice-cold methanol at 4°C for 20 min. Non-specific binding was blocked with 5% bovine serum albumin (BSA) in PBS for 30 min. Cells were stained with 1 µL of DyLight™ 488-conjugated LC3A/LC3B polyclonal antibody (Thermo Fisher Scientific; Cat. #PA1-16930-DYLT488) for 25 min at 4°C in the dark, washed with PBS, resuspended in 1% BSA/PBS, and analyzed via flow cytometry. This assay measures total cellular LC3A/B protein accumulation in permeabilized cells rather than dynamic flux in real time.
Fluorescence Microscopy for Autophagy Assessment
Autophagic vesicle morphology was characterized by sequential Acridine Orange (AO) vital staining and LC3A/B immunofluorescence on identical cell preparations. HepG2 cells were seeded at 1 × 10 cells per well into 6-well plates containing glass coverslips. For CoCl-containing cohorts (CoCl alone and CoCl + CQ), cells received 100 µM CoCl for 48 h followed by 25 µM CQ for 24 h (72 h total CoCl exposure). Normoxic control cohorts (vehicle control, 1 µM rapamycin, and 25 µM CQ alone) were treated for 24 h under standard culture conditions.
Following incubation, live cells were first stained with 0.2 µg/mL AO (Sigma-Aldrich) in complete medium for 15 min at 37°C in the dark to label acidic vesicular organelles (AVOs, including autolysosomes and lysosomes) in their native, unperturbed physiological state. Cells were rinsed with PBS, immediately fixed with 4% paraformaldehyde for 15 min, and permeabilized with 90% ice-cold methanol at 4°C for 20 min. Following blocking with 5% BSA/PBS for 30 min, cells were incubated with DyLight™ 488-conjugated anti-LC3A/B polyclonal antibody (Thermo Fisher Scientific; Cat. #PA1-16930-DYLT488; green channel) for 25 min at 4°C in the dark. Fluorescent signals for AO (red-orange channel, Texas Red/long-pass filter set) and LC3 (green channel, FITC filter set) were captured in a single imaging session per field of view using a Zeiss Axio Observer A1 inverted fluorescence microscope (Carl Zeiss, Jena, Germany). Puncta quantification and individual cell area measurements were performed using ImageJ software (NIH, Bethesda, MD, USA). Three independent replicate preparations were quantified per experimental condition (one representative field per replicate; individual raw counts documented in Supplementary Table S6). Because AO staining was performed prior to cell fixation, the red-orange signal reflects the distribution of acidic compartments at the moment of vital staining; while aldehyde fixation can partially attenuate AO fluorescence intensity, it preserves relative inter-group staining differences. The green LC3 signal, detected post-permeabilization, reflects aggregated LC3A/B puncta corresponding to autophagosome structures. The coordinated occurrence of elevated green LC3 puncta and depleted red-orange AO fluorescence was interpreted as indicative of autophagosome accumulation secondary to blocked autolysosome maturation, in accordance with established autophagy guidelines15,16,17.
Statistical Analysis
Data are presented as mean ± standard deviation (SD). Viability assays were conducted with three technical replicates per condition and repeated across two independent biological experiments (N = 2) using distinct cell passages and independently prepared reagents. The limitation of N = 2 relative to standard statistical requirements is acknowledged in the Limitations section. The RT-qPCR data were statistically analyzed in the original publication13 and were not re-evaluated here. Flow cytometric apoptosis percentages are reported descriptively; formal non-parametric hypothesis testing was not performed on these data because the small sample size (2–3 technical replicates from a single flow experiment) cannot yield a two-tailed Mann–Whitney Up-value below 0.10.
For fluorescence microscopy data, puncta counts were quantified across three independent preparations per group and are presented descriptively. Morphological cell area measurements were obtained from individual cells across multiple fields, providing sufficient statistical power for inferential analysis via the non-parametric Kruskal–Wallis test followed by Dunn’s multiple comparisons post hoc test, with p < 0.05 established as the threshold for statistical significance. As an exploratory proof-of-concept investigation, prospective power calculations were not conducted. Statistical evaluations and graphical plotting were executed using GraphPad Prism software (version 9.0; GraphPad Software Inc., San Diego, CA, USA).
Results
Validation of Chemical Hypoxia Induction by CoCl
The establishment of chemical hypoxia via CoCl in this HepG2 model was validated in our previous study13, which demonstrated significant transcriptional upregulation of downstream hypoxic markers (VEGF and GLUT1) and heightened DOX chemoresistance. In the present study, all hypoxia-mimetic drug combination experiments were performed using the identical validated CoCl regimen (100 µM, 72 h total exposure). In that validated dataset, exposure to 100 µM CoCl for 72 h elicited statistically significant increases in VEGF and GLUT1 mRNA expression compared with untreated controls (p < 0.05). In contrast, HIF-1α mRNA exhibited a minor, non-significant elevation. This differential pattern aligns with the established mechanism of CoCl, which stabilizes HIF-1α post-translationally by suppressing PHD-dependent enzymatic degradation, thereby driving the transcription of downstream effector genes (VEGF, GLUT1) without necessarily altering HIF-1α transcript abundance6,7. Because this validation was conducted at the mRNA level without direct chamber oxygen tension measurements or Western blot confirmation of HIF-1α protein accumulation, the experimental condition represents a chemically induced hypoxia-mimetic state rather than full physiological hypoxia.
CQ Inhibits Autophagic Flux in HepG2 Cells under Basal and Hypoxic Conditions
To characterize autophagic alterations, HepG2 cells were analyzed by sequential live-cell AO vital staining and fixed-cell LC3A/B immunofluorescence microscopy (Figure 1, Figure 2; full replicate imaging panels in Supplementary Figure S6). Treatment cohorts were structured to isolate the specific contributions of CQ and CoCl to autophagic machinery; DOX was deliberately omitted from imaging assays to prevent topoisomerase II-mediated DNA damage and off-target cytotoxic artifacts from confounding autophagic morphological readouts. Under basal normoxic conditions, vehicle-treated HepG2 cells exhibited low baseline intensities of both green LC3 fluorescence and red-orange AO signal, reflecting low basal autophagic turnover (Figure 1A). Treatment with the positive control rapamycin (1 µM, 24 h) induced a pronounced increase in both green LC3 puncta (autophagosomes) and red-orange AO staining (acidic autolysosomes), validating assay sensitivity for detecting robust autophagic pathway induction (Figure 1B).
Treatment with CQ alone (25 µM, 24 h) produced a distinct morphological pattern characterized by prominent accumulation of green LC3 punctate fluorescence alongside a markedly attenuated red-orange AO signal (Figure 1C). This phenotype—elevation of early autophagosome markers coinciding with loss of acidic vesicle fluorescence—is characteristic of impaired autophagosome–lysosome fusion and lysosomal deacidification, consistent with the pharmacological mechanism of CQ14. Under CoCl-induced chemical hypoxia (Figure 1D), both LC3-positive autophagosomes and AO-positive acidic vesicles increased compared with normoxic controls, indicating that hypoxic stress independently activates cytoprotective autophagy. Co-treatment with CoCl and CQ (Figure 1E) resulted in marked accumulation of green LC3 puncta alongside a substantial loss of red-orange AO signal compared with CoCl monotherapy. This indicates that CQ effectively impedes autolysosome maturation under hypoxic stress, causing autophagosome accumulation despite heightened upstream autophagic drive.
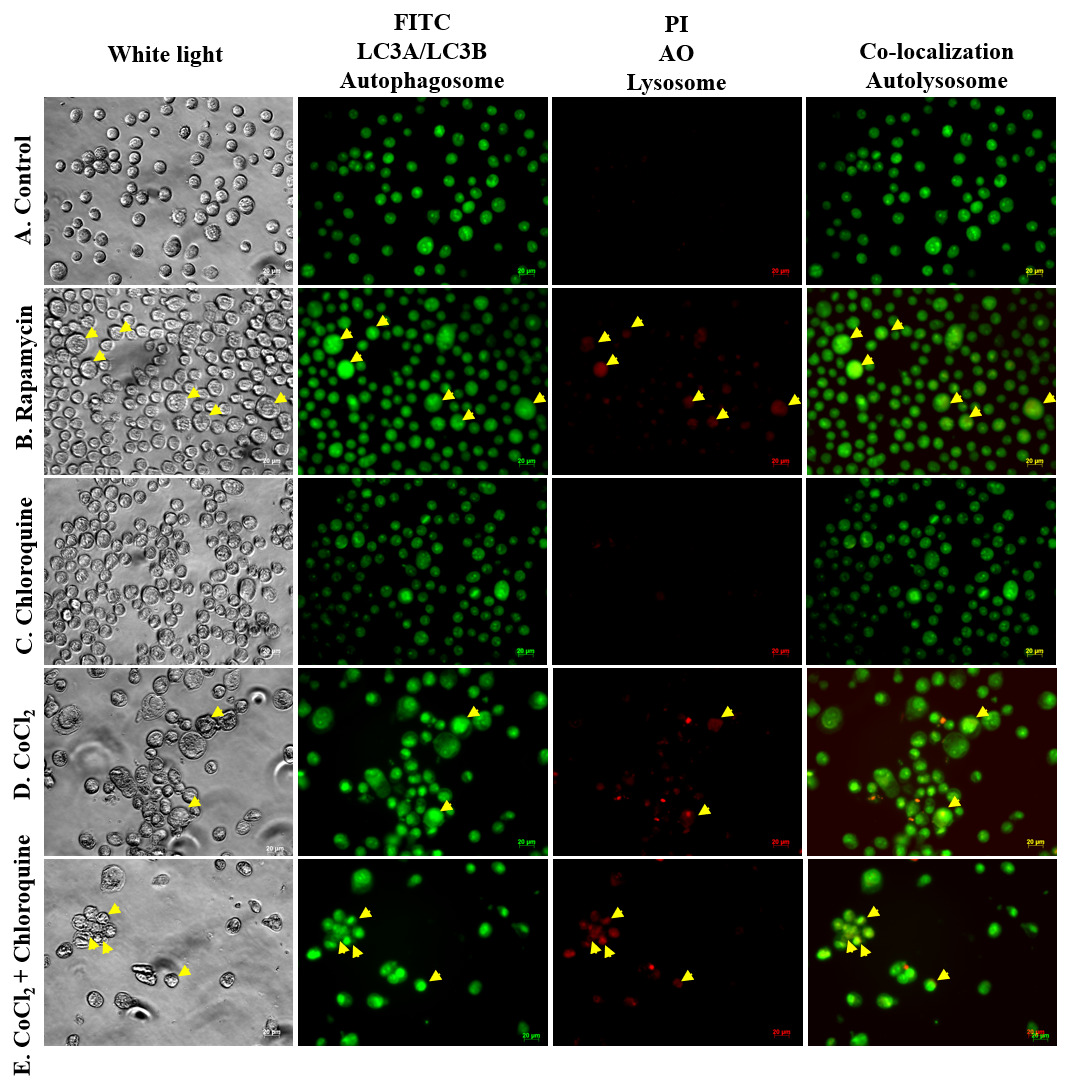
Qualitative fluorescence microscopy of autophagic vesicle dynamics and autophagosome accumulation in HepG2 cells following sequential Acridine Orange and LC3A/B immunostaining. HepG2 cells were subjected to five experimental treatment conditions to evaluate autophagic organelle remodeling. To preserve native physiological acidic gradients, live cells were initially incubated with Acridine Orange (AO; 0.2 µg/mL in complete medium, 15 min, 37°C in the dark) to selectively label acidic vesicular organelles (AVOs, including lysosomes and autolysosomes). Cells were subsequently fixed with 4% paraformaldehyde (15 min), permeabilized with 90% ice-cold methanol (4°C, 20 min), blocked with 5% BSA/PBS, and immunostained with DyLight™ 488-conjugated anti-LC3A/B polyclonal antibody (green channel; autophagosomes) for 25 min at 4°C. Dual-channel micrographs were acquired on a Zeiss Axio Observer A1 inverted fluorescence microscope using FITC (green channel; LC3A/B) and Texas Red/long-pass (red-orange channel; AO) filter sets. Columns from left to right display brightfield/white light, FITC/LC3A/B (autophagosomes), Texas Red/AO (lysosomes/AVOs), and merged co-localization (autolysosomes). Rows correspond to: (A) Vehicle control: normoxic basal culture displaying minimal baseline LC3 puncta and low AO signal; (B) Rapamycin (1 µM, 24 h): positive control for autophagy induction showing robust elevation of both green LC3 autophagosomes and red-orange AO acidic autolysosomes; (C) Chloroquine (CQ; 25 µM, 24 h): late-stage autophagy inhibition showing extensive LC3 punctate accumulation with diminished AO fluorescence, indicative of autophagosome accumulation secondary to blocked autolysosome fusion; (D) CoCl2 alone (100 µM, 72 h): chemical hypoxia induction demonstrating elevated baseline LC3 and AO puncta, confirming hypoxia-induced autophagic activation; and (E) CoCl2 + CQ (100 µM CoCl2 pre-treatment for 48 h followed by 25 µM CQ co-treatment for 24 h): maximal autophagosome accumulation (green LC3) coupled with marked depletion of acidic autolysosomes (red-orange AO), confirming effective CQ-mediated autophagy blockade under hypoxic stress. Representative yellow arrowheads highlight characteristic punctate structures. Scale bar = 20 µm (indicated in lower right of panels). Micrographs are representative of three independent biological replicate preparations (full replicate panels in
Quantitative image analysis of autophagic puncta and cell area is summarized in Figure 2 (individual counts in Supplementary Table S6). Rapamycin induced the highest total puncta count (mean 7,961 puncta/field across categories), followed by CoCl alone (2,636), CoCl + CQ (1,128), vehicle control (340), and CQ alone (137) (Figure 2A). In the CoCl + CQ group, autolysosome-associated puncta dropped from a mean of 973 (CoCl alone) to 165 puncta/field, whereas autophagosome-associated puncta remained elevated (650 puncta/field). Morphometric analysis revealed significant increases in mean cell area in the rapamycin (p < 0.0001), CoCl alone (p < 0.001), and CoCl + CQ (p < 0.05) groups relative to vehicle controls (Figure 2B), whereas CQ monotherapy produced no significant change. This cellular enlargement may reflect cytoplasmic vacuolation and swollen autophagosomal structures secondary to disrupted catabolic clearance.
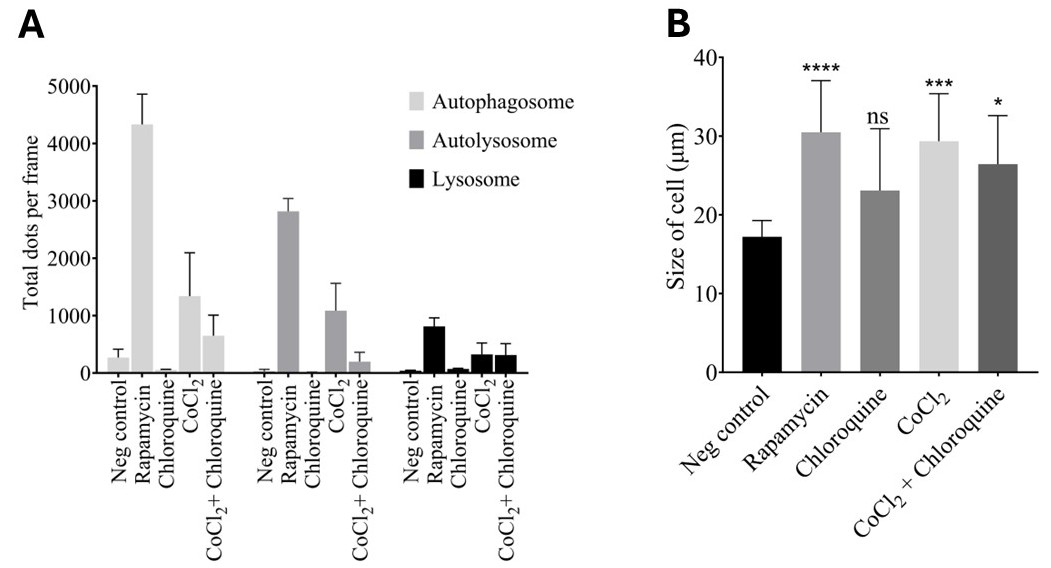
Quantitative morphometric analysis of autophagic puncta and cellular area in HepG2 cells across normoxic and hypoxic treatment conditions. Quantitative analysis of fluorescence micrographs acquired from HepG2 cells subjected to indicated treatments (vehicle control, 1 µM rapamycin, 25 µM chloroquine [CQ], 100 µM CoCl2, and 100 µM CoCl2 + 25 µM CQ) as described in
CQ Sensitizes HepG2 Cells to Cell Death under Normoxic and Hypoxic Conditions
Cell death and apoptosis were quantified via Annexin V/7-AAD flow cytometry across all treatment groups (Figure 3, Table 1; complete replicate dot plots in Supplementary Figure S5, raw replicate data in Supplementary Table S5). Under normoxia, DOX monotherapy (62.5 nM, 24 h) induced minimal cell death (4.50% ± 0.28%). Co-administration of CQ (25 µM) markedly elevated total cell death to 98.32% ± 0.61%. Under CoCl-induced hypoxia, single-agent DOX elicited slightly reduced cytotoxicity (3.43% ± 0.45%), consistent with hypoxia-mediated chemoresistance, although this modest difference was not evaluated for statistical significance due to sample size constraints. The DCC triple combination (DOX + CQ + CoCl) produced 95.76% ± 0.88% total cell death.
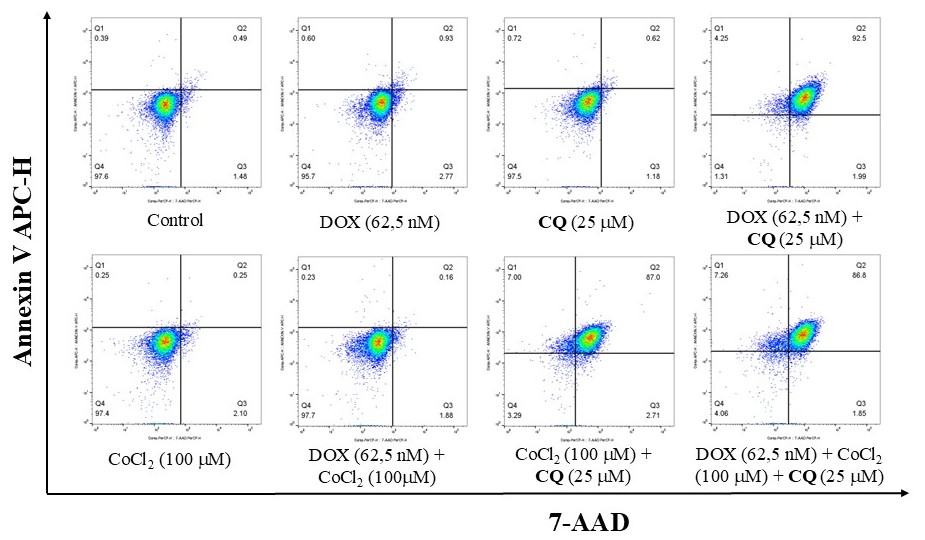
Flow cytometric profiling of apoptotic and necrotic cell death in HepG2 cells treated with doxorubicin and chloroquine under normoxic and CoCl2-induced hypoxic conditions. Representative biparametric Annexin V/7-AAD flow cytometry dot plots of HepG2 cells following 24 h drug treatments under normoxia (upper row) and chemical hypoxia (100 µM CoCl2 for 72 h total; lower row). Cells were stained with Annexin V–APC (y-axis, APC channel) and 7-AAD (x-axis, PerCP channel) and analyzed on a BD FACS Melody™ flow cytometer (10,000 singlet events acquired per sample; FlowJo analysis). Quadrants define: Q4 (lower left: viable cells, Annexin V−/7-AAD−), Q1 (upper left: early apoptotic cells, Annexin V+/7-AAD−), Q2 (upper right: late apoptotic/secondary necrotic cells, Annexin V+/7-AAD+), and Q3 (lower right: primary necrotic cells, Annexin V−/7-AAD+). Numerical values within quadrants indicate the percentage of gated cells. Treatment groups shown: Top row (Normoxia): Untreated control (97.6% viable), DOX (62.5 nM; 95.7% viable), CQ (25 µM; 97.5% viable), and DOX (62.5 nM) + CQ (25 µM; 92.5% late apoptotic, 98.32% total cell death). Bottom row (Hypoxia, 100 µM CoCl2): CoCl2 alone (97.4% viable), DOX (62.5 nM) + CoCl2 (97.7% viable), CoCl2 + CQ (25 µM; 87.0% late apoptotic, 96.43% total cell death), and DOX (62.5 nM) + CoCl2 + CQ (25 µM) [DCC] (86.8% late apoptotic, 95.76% total cell death). Percentage values represent means of technical replicates (
Notably, the hypoxic control group receiving CoCl + CQ without DOX exhibited 96.43% ± 0.74% cell death, which is statistically indistinguishable from the DCC triple combination (95.76%). This demonstrates that under prolonged hypoxic stress (72 h CoCl), HepG2 cells become exceptionally dependent on basal lysosomal autophagic clearance for survival, such that late-stage autophagy inhibition via 25 µM CQ alone induces near-complete cell death. Consequently, the fixed-dose apoptosis assay displays a ceiling effect at 25 µM CQ, obscuring DOX-specific synergistic increments in this specific assay format. The full dose-ranging Chou–Talalay viability analysis described below resolves this interaction across dynamic effect levels.
Cytotoxic effects of doxorubicin and chloroquine treatments in HepG2 cells under normoxic and CoCl2-induced hypoxic conditions.
| Experimental Treatment Group | Microenvironmental Oxygen Condition | Total Cytotoxicity (% Cell Death) | Incremental Cell Death Conferred by CQ Addition (%) |
|---|---|---|---|
| Doxorubicin (DOX; 62.5 nM) alone | Normoxia (21% O2) | 4.50 ± 0.28% | — |
| DOX (62.5 nM) + Chloroquine (CQ; 25 µM) | Normoxia (21% O2) | 98.32 ± 0.61% | +93.82% |
| Doxorubicin (DOX; 62.5 nM) alone | Hypoxia (100 µM CoCl2, 72 h) | 3.43 ± 0.45% | — |
| DOX (62.5 nM) + Chloroquine (CQ; 25 µM) [DCC] | Hypoxia (100 µM CoCl2, 72 h) | 95.76 ± 0.88% | +92.33% |
| CoCl2 (100 µM) + CQ (25 µM) [without DOX] | Hypoxia (100 µM CoCl2, 72 h) | 96.43 ± 0.74% | N/A (no DOX comparator) |
Chou–Talalay Pharmacological Synergy Analysis
Effect of the DCC Triple Combination under CoCl-Induced Hypoxia
Under CoCl-induced hypoxia, the DCC combination demonstrated potent, dose-dependent inhibition of cell growth across the entire DOX concentration range (0.016–0.5 µM), with the fraction affected (Fa) ranging from 0.690 to 0.790 (Table 2, Figure 4). This elevated baseline Fa reflects the underlying growth-inhibitory contribution of 100 µM CoCl. Calculated CI values remained consistently below 1 across all tested concentrations (CI = 0.354–0.548), indicating stable drug synergism (Table 2, Figure 4D). Decomposition of the three-component CI equation (CI = 1/DRI + 1/DRI + 1/DRI) indicated that the CoCl term contributed 87% of the total index at 0.016 µM DOX and 47% at 0.5 µM DOX. Thus, the DCC values reflect a three-drug mathematical model and are not directly comparable to two-drug normoxic indices.
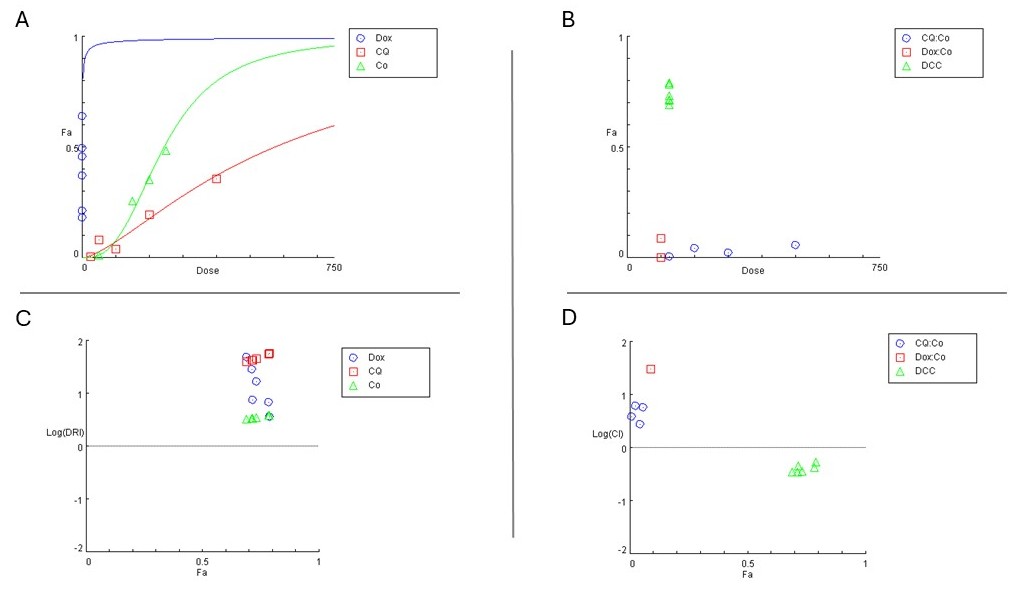
Chou–Talalay median-effect and synergy analysis of the three-component DCC combination (DOX + CQ + CoCl2) in HepG2 cells under chemically induced hypoxia. Pharmacological synergy modeling for the DCC triple combination in HepG2 cells pre-treated with 100 µM CoCl2 for 48 h followed by 24 h co-treatment with DOX (0.016–0.5 µM) and CQ (25 µM). Cell viability was quantified via Alamar Blue assay, and drug interaction parameters were calculated using CompuSyn software according to the Chou–Talalay median-effect equation. (A) Dose–effect curves: Inhibitory fraction affected (
Combination Index (CI) and Dose Reduction Index (DRI) parameters for the three-component DCC combination in HepG2 cells under chemically induced hypoxia.
| DOX Concentration (µM) | Fraction Affected ( | Combination Index (CI) | DOX Dose Reduction Index (DRIDOX) |
|---|---|---|---|
| 0.016 | 0.690 | 0.354 | 48.68 |
| 0.031 | 0.712 | 0.355 | 28.96 |
| 0.063 | 0.732 | 0.367 | 17.04 |
| 0.125 | 0.716 | 0.451 | 7.48 |
| 0.250 | 0.784 | 0.422 | 6.84 |
| 0.500 | 0.790 | 0.548 | 3.64 |
Dose Reduction Index (DRI) calculations for DOX revealed substantial dose-sparing potential, ranging from 3.64-fold at 0.5 µM DOX to a maximum of 48.68-fold at 0.016 µM DOX (Table 2, Figure 4C). DRI values for CQ and CoCl were omitted because both agents were maintained at fixed concentrations rather than varied at constant equipotent ratios with DOX, precluding rigorous pharmacological interpretation of their individual DRI values. In Figure 4B, the pairwise CQ:CoCl reference curve displayed minimal growth inhibition (Fa < 0.01) because it was generated using a shorter 24 h CoCl pre-treatment protocol during initial curve fitting, whereas the DCC and apoptosis assays utilized a 48 h pre-treatment plus 24 h co-treatment protocol (72 h total CoCl).
Effect of the DOX:CQ Double Combination under Normoxia
Under normoxic conditions, the two-agent DOX:CQ combination achieved a lower maximum growth inhibition (Fa ≈ 0.571) compared with the hypoxic DCC combination (Fa ≈ 0.790) (Table 3, Figure 5). In contrast to the stable synergism observed under hypoxia, the normoxic DOX:CQ combination exhibited a pronounced dose-dependent transition: robust synergism was observed at low DOX concentrations (CI = 0.345 at 0.016 µM; CI = 0.297 at 0.031 µM), which progressively shifted toward additivity (CI = 0.810 at 0.25 µM) and frank antagonism at the highest tested concentration (CI = 1.581 at 0.5 µM DOX) (Table 3, Figure 5C).
Combination Index (CI) and Dose Reduction Index (DRI) parameters for the two-agent DOX:CQ combination in HepG2 cells under normoxia.
| DOX Concentration (µM) | Fraction Affected ( | Combination Index (CI) | DOX Dose Reduction Index (DRIDOX) |
|---|---|---|---|
| 0.016 | 0.320 | 0.345 | 3.68 |
| 0.031 | 0.432 | 0.297 | 4.10 |
| 0.063 | 0.434 | 0.535 | 2.07 |
| 0.125 | 0.521 | 0.581 | 1.85 |
| 0.250 | 0.571 | 0.810 | 1.29 |
| 0.500 | 0.571 | 1.581 | 0.65 |
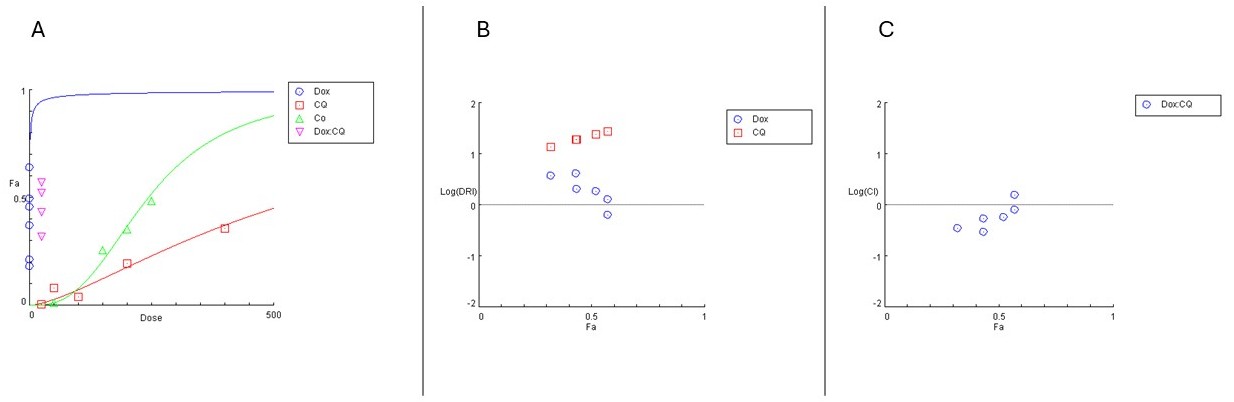
Chou–Talalay median-effect and synergy analysis of the two-agent DOX:CQ combination in HepG2 cells under normoxia. Pharmacological synergy modeling for the two-agent DOX:CQ combination in HepG2 cells co-treated with DOX (0.016–0.5 µM) and CQ (25 µM) simultaneously for 24 h under normoxic conditions (21% O2). Viability was determined by Alamar Blue assay and analyzed in CompuSyn using the Chou–Talalay method. (A) Dose–effect curves: Fraction affected (
DRI values for DOX under normoxia ranged from 0.65 to 4.10, peaking at 0.031 µM DOX (Table 3, Figure 5B). Growth inhibition reached a plateau at 0.25–0.50 µM DOX (Fa = 0.571). Median-effect goodness-of-fit coefficients were r = 0.983 (r = 0.966) for DOX and r = 0.995 (r = 0.991) for CoCl, but r = 0.918 (r = 0.843) for CQ, introducing a degree of mathematical uncertainty that propagates into derived CI and DRI values.
Discussion
Chemoresistance driven by microenvironmental hypoxia represents a major barrier to successful systemic chemotherapy in advanced hepatocellular carcinoma. In this study, we investigated whether pharmacological autophagy inhibition with chloroquine modulates doxorubicin sensitivity in HepG2 cells under normoxic versus CoCl-induced hypoxic conditions, and whether these interactions exhibit distinct pharmacological characteristics when modeled using the Chou–Talalay method. Our findings yield three primary insights: (1) CoCl-induced chemical hypoxia activates a functional hypoxic transcriptional response and stimulates autophagic activity; (2) CQ induces morphological alterations consistent with late-stage autophagosome–lysosome fusion blockade under both normoxia and hypoxia; and (3) hypoxia alters the dose-dependent trajectory of the DOX–CQ combination, maintaining synergistic interaction across the tested DOX dose range under hypoxia, whereas normoxic co-treatment transitions into antagonism at higher DOX concentrations.
The morphological imaging findings provide supportive evidence for autophagy modulation. In HepG2 cells, CQ treatment elevated LC3-positive autophagosomal puncta while concurrently suppressing AO-positive acidic vesicular staining, a phenotype characteristic of impaired autophagosome degradation secondary to lysosomal neutralization14. Under CoCl exposure, basal autophagic activity was elevated, corroborating reports that hypoxic stress triggers adaptive autophagy in HCC7,8. The marked accumulation of autophagosomes alongside depleted acidic autolysosomes in the CoCl + CQ group demonstrates that CQ retains its lysosomotropic inhibitory activity under hypoxic stress. However, because these conclusions rest on fluorescence microscopy and puncta counts rather than biochemical assessment of LC3-II/LC3-I conversion or p62/SQSTM1 turnover by Western blot, these data reflect autophagy-associated morphological changes rather than definitive autophagic flux quantification15,16.
The primary clinical rationale for combining CQ with DOX is dose sparing to mitigate anthracycline-induced cardiotoxicity while overcoming resistance (Minotti et al., 2004). In our apoptosis assays, DOX monotherapy (62.5 nM) exhibited minimal cytotoxicity under both normoxia (4.50%) and hypoxia (3.43%), whereas CQ co-treatment elicited >95% cell death across both oxygenation states. Importantly, CoCl + CQ in the absence of DOX induced 96.43% cell death, demonstrating that hypoxic HepG2 cells are acutely dependent on intact lysosomal autophagy for survival. This pronounced baseline sensitivity creates a ceiling effect at 25 µM CQ in the single-dose apoptosis assay, precluding the detection of DOX-specific synergistic increments in that format. The Chou–Talalay viability analysis resolved this limitation by evaluating drug interactions across a continuous dose range.
The Chou–Talalay analysis revealed a notable divergence in combination pharmacology between oxygenation states. Under normoxia, DOX:CQ synergism was restricted to lower DOX concentrations (0.016–0.125 µM) and deteriorated into antagonism at 0.5 µM (CI = 1.581). This high-dose normoxic antagonism may arise from CQ-mediated alterations in lysosomal drug sequestration or intracellular DOX distribution independent of autophagic pathways18,19. Conversely, under CoCl-induced hypoxia, the DCC combination maintained CI values below 1 (0.354–0.548) across all tested DOX concentrations, yielding a projected DOX dose reduction of up to 48.68-fold. Because CoCl was modeled as a third active component in the hypoxic CI equation, these values cannot be directly equated to the two-drug normoxic CI. Nonetheless, the data support the hypothesis that hypoxic stress amplifies cellular dependence on autophagy, creating a sustained targetable vulnerability.
Study Limitations
Several methodological limitations must be considered when interpreting these findings:
-
Single Cell Line Model: All experiments were performed exclusively in HepG2 cells; validation in additional HCC lines (e.g., Huh7, PLC/PRF/5) and patient-derived primary models is essential to account for HCC heterogeneity.
-
Chemical Hypoxia vs. Physical Hypoxia: CoCl2 was utilized to chemically mimic hypoxia. Although validated by
VEGF andGLUT1 mRNA upregulation13, CoCl2 does not fully replicate physiological low-oxygen tension and may exert pleiotropic heavy-metal effects. Furthermore, direct Western blot confirmation of HIF-1α protein stabilization was not performed in this study. -
Autophagic Flux Validation: Autophagy was assessed via sequential AO/LC3 immunofluorescence rather than gold-standard biochemical assays (Western blotting for LC3 lipidation and p62/SQSTM1 degradation).
-
Sample Size and Replicates: Viability assays were repeated across two independent biological experiments (
N = 2), below the conventional standard ofN ≥ 3 required for robust inferential statistics, and apoptosis assays comprised 2–3 technical replicates from a single experiment. -
Mathematical Modeling Constraints: The hypoxic Chou–Talalay model incorporated CoCl2 as a third component drug, preventing direct numerical comparison with normoxic two-agent CI values. In addition, the median-effect fit for CQ (
r 2 = 0.843) was lower than for DOX (r 2 = 0.966) and CoCl2 (r 2 = 0.991). -
Lack of Normal Hepatocyte Controls: Non-malignant hepatocytes (e.g., primary human hepatocytes or LO2 cells) were not evaluated, leaving the therapeutic index and cancer cell selectivity uncharacterized.
Conclusion
In summary, this study demonstrates that chloroquine enhances doxorubicin cytotoxicity in HepG2 hepatocellular carcinoma cells with distinct pharmacological kinetics governed by microenvironmental oxygenation. Under normoxic conditions, DOX–CQ synergism is dose-dependent and transitions into antagonism at elevated DOX concentrations. Under CoCl-induced hypoxia, combination treatment maintains stable synergy across the tested DOX dose range and affords substantial theoretical DOX dose reduction. These findings indicate that hypoxia-induced cytoprotective autophagy represents a viable therapeutic target to circumvent anthracycline chemoresistance in HCC. Future investigations utilizing physical hypoxia chambers, multiple HCC cell models, biochemical flux assays, and in vivo xenografts are warranted to validate the translational feasibility of this combination approach.
Abbreviations
7-AAD: 7-Aminoactinomycin D; AO: Acridine Orange; ATCC: American Type Culture Collection; AVO: Acidic Vesicular Organelle; BSA: Bovine Serum Albumin; CI: Combination Index; CoCl: Cobalt(II) Chloride; CQ: Chloroquine; DCC: Doxorubicin + Chloroquine + Cobalt Chloride combination; DMEM: Dulbecco’s Modified Eagle Medium; DMSO: Dimethyl Sulfoxide; DOX: Doxorubicin; DRI: Dose Reduction Index; Fa: Fraction affected; FBS: Fetal Bovine Serum; FITC: Fluorescein Isothiocyanate; GLUT1: Glucose Transporter 1; HBV: Hepatitis B Virus; HCC: Hepatocellular Carcinoma; HCV: Hepatitis C Virus; HIF-1α: Hypoxia-Inducible Factor 1-alpha; LC3: Microtubule-associated protein 1A/1B-light chain 3; PBS: Phosphate-Buffered Saline; PHDs: Prolyl Hydroxylase Domain-containing enzymes; ROS: Reactive Oxygen Species; RT-qPCR: Reverse Transcription-Quantitative Polymerase Chain Reaction; SD: Standard Deviation; TME: Tumor Microenvironment; VEGF: Vascular Endothelial Growth Factor.
Acknowledgments
The authors gratefully acknowledge the administrative assistance provided by Ms. Nha Khanh and Mr. Minh Nghia. Sincere appreciation is also extended to Mr. The Nhan, Mr. Dat, and Mr. Chau Nhat for their technical support, and to Prof./Dr. Phuc Pham for insightful scientific guidance and valuable discussions.
Author’s contributions
Chau-Huynh Dao Minh: Conceptualization, investigation, formal analysis, fluorescence microscopy, and flow cytometry assays. Thu-Dang Pham Anh: Investigation, cell culture, and chemical hypoxia model optimization. Sinh Nguyen: Conceptualization, project administration, supervision, formal analysis, Chou–Talalay synergy modeling, writing – original draft, and writing – review & editing. All authors read and approved the final manuscript.
Funding
This research was financially supported by the VNUHCM-US Stem Cell Institute, University of Science, Vietnam National University Ho Chi Minh City, Vietnam, under grant number NCKH-SCI.06/24.
Availability of data and materials
The datasets generated and/or analyzed during the current study are available from the corresponding author upon reasonable request.
Ethics approval and consent to participate
Not applicable. This investigation was conducted entirely in vitro using an established commercial human cell line (HepG2, ATCC HB-8065) and did not involve human participants, clinical tissue specimens, or live animal experiments.
Consent for publication
Not applicable.
Declaration of generative AI and AI-assisted technologies in the writing process
During the preparation of this work, the authors did not use generative AI or AI-assisted technologies in the writing process.
Competing interests
The authors declare that they have no competing financial or non-financial interests.