


Fibroblast Growth Factor-23 (FGF-23) and Its Correlation with Renal Function and Bone Mineral Markers in a Sample of Iraqi Patients with Chronic Kidney Disease and Those Undergoing Hemodialysis

- Department of Medical Laboratories Techniques, College of Health and Medical Technology, University of Al Maarif, Al Anbar,31001, Iraq
- Education College For Women, University of Anbar, Anbar, Iraq
- College of Pharmacy, University of Anbar, Anbar, Iraq
- Iraqi Ministry of Health, Anbar Health Department, Al-Ramadi Teaching Hospital For Maternity and Children, Anbar, Iraq
Abstract
Background: Fibroblast growth factor-23 (FGF-23) plays a central role in mineral metabolism and is implicated in the pathogenesis of chronic kidney disease–mineral and bone disorder (CKD-MBD). This study aimed to evaluate the relationships between serum FGF-23 concentrations and clinical, renal function, and bone mineral parameters in pre-dialysis chronic renal failure (CRF) patients and maintenance hemodialysis (HD) patients in an Iraqi cohort.
Methods: This cross-sectional study enrolled 90 participants divided into three equal groups (n = 30 per group): pre-dialysis CRF patients (CKD stages 3–5), maintenance HD patients, and age- and sex-matched healthy controls. Venous blood samples were analyzed for serum intact FGF-23, phosphorus, calcium, parathyroid hormone (PTH), total vitamin D, urea, creatinine, and uric acid. Group differences, bivariate associations, and diagnostic accuracy were assessed using one-way analysis of variance (ANOVA) with Bonferroni post-hoc correction, Pearson’s correlation coefficient, and receiver operating characteristic (ROC) curve analysis, respectively.
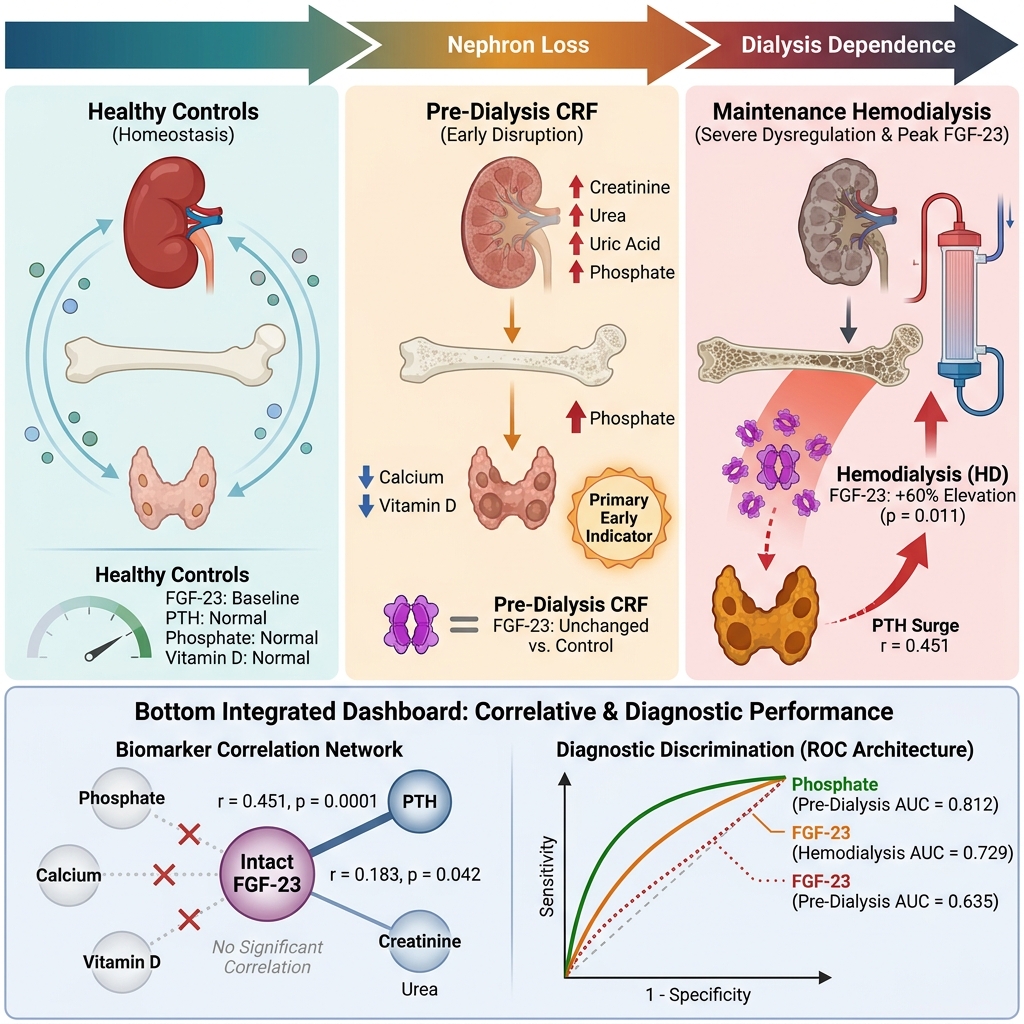
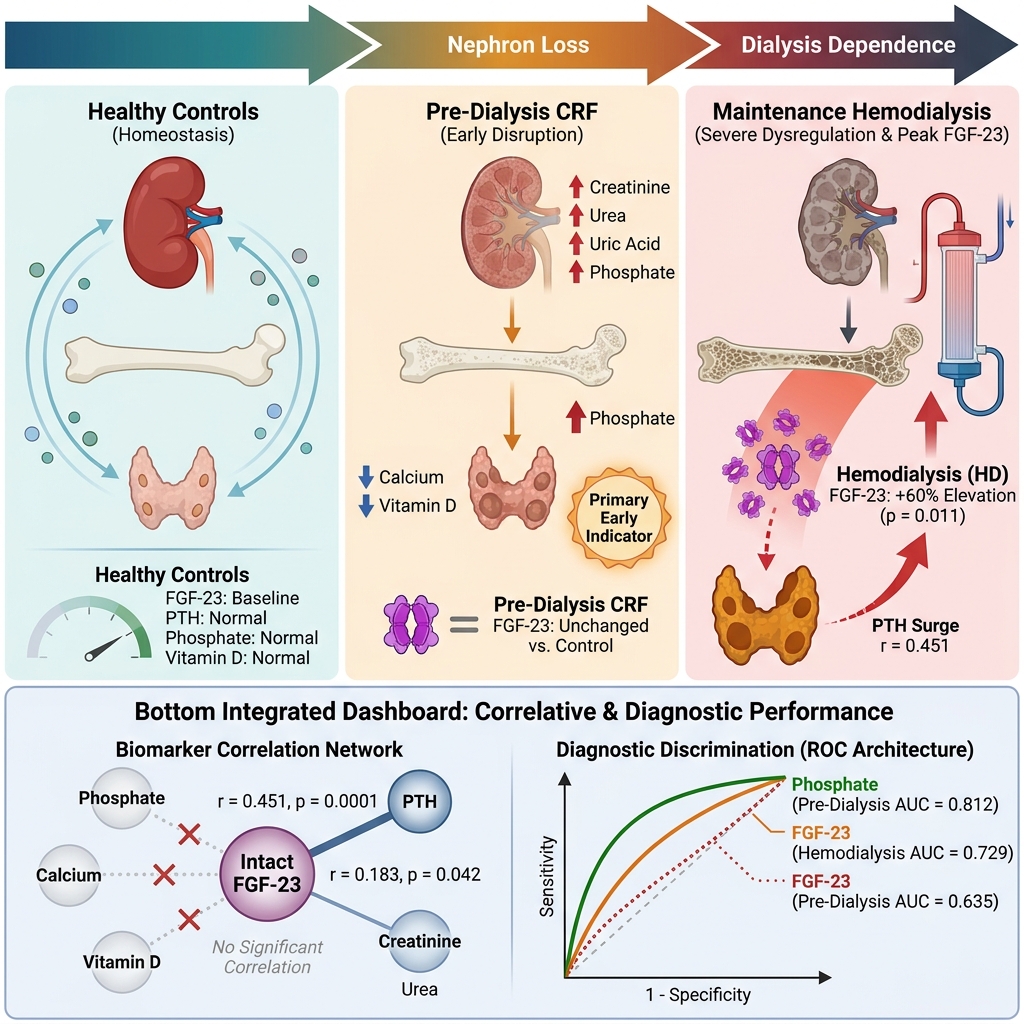
Results: Serum FGF-23 levels were significantly elevated in HD patients compared with healthy controls (216.5 ± 30.92 vs. 134.7 ± 17.08 pg/mL; p = 0.011), accompanied by marked increases in serum phosphorus and PTH and significantly reduced vitamin D and calcium concentrations. Across the study cohort, serum FGF-23 exhibited a moderate positive correlation with PTH (r = 0.451, p = 0.0001) and a weak positive correlation with serum creatinine (r = 0.183, p = 0.042), whereas no significant correlations were observed with serum phosphorus, calcium, or vitamin D. In ROC curve analysis discriminating pre-dialysis CRF patients from controls, the area under the curve (AUC) values were 0.812 for phosphorus, 0.785 for vitamin D, 0.710 for PTH, and 0.635 for FGF-23. In discriminating HD patients from controls, AUC values were 0.874 for phosphorus, 0.774 for PTH, 0.733 for vitamin D, and 0.729 for FGF-23.
Conclusions: Elevated circulating FGF-23 concentrations are associated with impaired renal function and secondary hyperparathyroidism, particularly among patients receiving maintenance hemodialysis. Although serum FGF-23 reflects disturbances in the bone–parathyroid–kidney axis in advanced renal disease, larger longitudinal studies are warranted to establish its independent prognostic value for CKD progression and clinical outcomes.
Graphical abstract
Background
Chronic kidney disease (CKD) is characterized by a progressive decline in renal function occurring over months or years. Affecting approximately 10% of the global population, CKD imposes substantial morbidity, mortality, and healthcare costs worldwide1. Clinically, CKD is defined by the presence of structural or functional kidney damage or a reduced glomerular filtration rate (GFR < 60 mL/min/1.73 m²)2 persisting for at least 3 months, irrespective of the underlying etiology3. Hemodialysis (HD) serves as the primary renal replacement therapy (RRT) for patients with end-stage kidney disease (ESKD), facilitating the extracorporeal clearance of metabolic waste products, excess fluid, and electrolytes when endogenous renal function becomes inadequate4. Both pre-dialysis CKD and maintenance HD are closely associated with profound disturbances in mineral homeostasis, particularly alterations in parathyroid hormone (PTH) secretion, which adversely affect clinical outcomes. Secondary hyperparathyroidism, characterized by persistently elevated circulating PTH levels, represents a hallmark complication of progressive CKD and contributes to skeletal and cardiovascular morbidity5.
Disordered phosphate homeostasis is another critical determinant of cardiovascular risk and all-cause mortality in patients with CKD and those undergoing maintenance HD. As renal excretory capacity diminishes, impaired urinary phosphate clearance frequently leads to hyperphosphatemia6. Concurrently, vitamin D deficiency and insufficiency are highly prevalent among pre-dialysis CKD and HD populations. Because vitamin D plays an essential role in regulating calcium–phosphate balance and parathyroid function, optimizing vitamin D status is a cornerstone of clinical management; notably, high-dose cholecalciferol (vitamin D3) supplementation can safely restore serum 25-hydroxyvitamin D levels and attenuate PTH hypersecretion without inducing hypercalcemia7. Fibroblast growth factor-23 (FGF-23) is a bone-derived phosphaturic hormone synthesized predominantly by osteocytes and osteoblasts. It acts as a master regulator of systemic phosphate homeostasis and vitamin D metabolism by inhibiting renal tubular phosphate reabsorption and suppressing 1α-hydroxylase activity8.
Therefore, the present study aimed to investigate circulating intact FGF-23 levels and evaluate their correlations with renal function indices and key regulators of mineral metabolism—specifically PTH, vitamin D, calcium, and phosphorus—in an Iraqi cohort of pre-dialysis chronic renal failure (CRF) patients and maintenance HD patients.
Methods
Study design and participants
This cross-sectional study was conducted between October 2024 and January 2025 at the Dialysis Center of the Anbar Health Department, Anbar, Iraq. A total of 90 participants were enrolled and categorized into three equal groups (n = 30 per group): Group 1 comprised 30 pre-dialysis patients with chronic renal failure (CRF; CKD stages 3–5 based on estimated GFR [eGFR]); Group 2 included 30 patients with end-stage renal disease (ESRD) undergoing regular maintenance hemodialysis (HD), from whom venous blood samples were collected immediately prior to the initiation of a scheduled dialysis session; and Group 3 consisted of 30 apparently healthy, age- and sex-matched control individuals with no clinical history of renal or systemic disease.
The diagnosis of CKD was established based on clinical evaluation, medical history, renal ultrasonography, computed tomography (CT) imaging, and biochemical laboratory findings. Participant ages ranged from 29 to 90 years in the patient cohorts (CRF and HD) and from 38 to 75 years in the healthy control group.
Inclusion and exclusion criteria
Adult patients (aged ≥ 18 years) were eligible for enrollment if they had a confirmed diagnosis of pre-dialysis CRF (CKD stages 3–5) or were receiving regular maintenance HD. Patients were excluded if they presented with acute infections, active malignancies, or were receiving pharmacological agents known to substantially alter bone and mineral metabolism, specifically phosphate binders or active vitamin D analogues. Individuals who did not fulfill the predefined clinical diagnostic criteria for their respective groups were also excluded. Healthy control participants were required to have normal renal function and no history of chronic kidney, endocrine, or systemic inflammatory disorders.
Sample collection and biochemical assays
Four milliliters (4 mL) of peripheral venous blood was drawn from the antecubital vein of each participant into gel-separator tubes and allowed to clot for 20 minutes at room temperature. Following coagulation, samples were centrifuged at 2000 × g for 10 minutes, and the separated sera were divided into aliquots. Serum concentrations of urea, creatinine, uric acid, total calcium, and inorganic phosphorus were quantified immediately using standardized enzymatic and colorimetric methods.
The remaining serum aliquots were stored at −20 °C, avoiding repeated freeze–thaw cycles, until batch analysis of hormonal biomarkers. Serum total vitamin D (ng/mL) and intact PTH (pg/mL) levels were measured by electrochemiluminescence (ECL) immunoassay on a Cobas e411 analyzer (Roche Diagnostics). Serum FGF-23 concentrations (pg/mL) were quantified using a commercial human enzyme-linked immunosorbent assay (ELISA) kit (Bioassay Technology Laboratory [BT Lab], Cat. No. E0138Hu), which primarily detects biologically active intact FGF-23 (iFGF-23).
Sample size calculation and statistical analysis
Sample size was calculated a priori using G*Power software (version 3.1.9.7) for a one-way analysis of variance (ANOVA) across three groups, assuming an effect size of f = 0.40, a two-sided significance level (α) of 0.05, and a statistical power (1 − β) of 0.80. The calculation indicated a minimum required total sample size of 66 participants; thus, our enrolled cohort of 90 participants (30 per group) provided adequate statistical power.
Statistical analyses were performed using IBM SPSS Statistics software. Categorical variables were summarized as frequencies and percentages, n (%), and compared using the chi-square (χ²) test. Data normality for continuous variables was evaluated using the Shapiro–Wilk test. Normally distributed continuous variables were expressed as mean ± standard error (SE) alongside minimum and maximum ranges. Intergroup differences across the three independent cohorts (healthy controls, pre-dialysis CRF, and HD) were analyzed using one-way ANOVA, followed by Bonferroni-adjusted post-hoc multiple comparisons to control for Type I error when the omnibus ANOVA was statistically significant. Bivariate linear associations between serum FGF-23 and other continuous clinical and biochemical variables were assessed using Pearson’s correlation coefficient (r). Receiver operating characteristic (ROC) curve analysis was performed separately for the pre-dialysis CRF and HD groups versus healthy controls to determine the area under the curve (AUC), optimal cut-off thresholds, diagnostic sensitivity, and specificity of the studied biomarkers. A two-sided p-value < 0.05 was considered statistically significant.
Results
Baseline demographic and clinical characteristics
The baseline demographic, anthropometric, and clinical characteristics of the healthy control (n = 30), pre-dialysis CRF (n = 30), and maintenance HD (n = 30) groups are summarized in Table 1. Mean age did not differ significantly across the three groups (p = 0.143), with mean ± SE values of 58.4 ± 2.51 years in the CRF group, 52.3 ± 2.01 years in the HD group, and 55.7 ± 2.01 years in the control group. Similarly, sex distribution was comparable among the groups (p = 0.539), with female participants accounting for 60.0% of the CRF group, 56.7% of the HD group, and 43.3% of the control group.
Baseline demographic, anthropometric, and clinical characteristics of healthy controls, pre-dialysis CRF patients, and maintenance HD patients.
| Variable | Healthy Controls (n = 30) | Pre-dialysis CRF (n = 30) | Maintenance HD (n = 30) | p-value |
|---|---|---|---|---|
| Age (years), Mean ± SE | 55.7 ± 2.01 | 58.4 ± 2.51 | 52.3 ± 2.01 | 0.143 |
| Age (years), Min.–Max. | 38–75 | 29–90 | 33–72 | — |
| Sex: Male, n (%) | 17 (56.7%) | 12 (40.0%) | 13 (43.3%) | 0.539 |
| Sex: Female, n (%) | 13 (43.3%) | 18 (60.0%) | 17 (56.7%) | — |
| BMI (kg/m²), Mean ± SE | 28.3 ± 0.66 | 32.4 ± 0.59 | 33.8 ± 0.67 | 0.0001 |
| BMI (kg/m²), Min.–Max. | 20.5–35.5 | 26.5–39.08 | 27.5–41.4 | — |
| BMI Category: Normal, n (%) | 7 (23.3%) | 0 (0.0%) | 0 (0.0%) | 0.0001 |
| BMI Category: Overweight, n (%) | 13 (43.3%) | 6 (20.0%) | 4 (13.3%) | — |
| BMI Category: Obesity, n (%) | 10 (33.4%) | 24 (80.0%) | 26 (86.7%) | — |
| Family History: Yes, n (%) | 0 (0.0%) | 10 (33.3%) | 8 (26.7%) | 0.034 |
| Family History: No, n (%) | 30 (100.0%) | 20 (66.7%) | 22 (73.3%) | — |
In contrast, body mass index (BMI) differed significantly across the cohorts (p = 0.0001). Both the pre-dialysis CRF (32.4 ± 0.59 kg/m²) and HD (33.8 ± 0.67 kg/m²) groups exhibited significantly higher mean BMI values compared with healthy controls (28.3 ± 0.66 kg/m²), reflecting a markedly higher prevalence of obesity in the patient cohorts (80.0% in CRF and 86.7% in HD vs. 33.4% in controls; p = 0.0001). Furthermore, a positive family history of renal disease was reported in 33.3% of CRF patients and 26.7% of HD patients, whereas none of the healthy controls reported a family history of kidney disease (p = 0.034).
Comparison of renal function and bone mineral biomarkers
Biochemical parameters across the three study groups are presented in Table 2. Serum urea and creatinine concentrations were significantly elevated in both the CRF and HD groups compared with healthy controls (p = 0.0001). Notably, mean serum creatinine was highest in the pre-dialysis CRF cohort (6.97 ± 0.43 mg/dL), compared with 3.58 ± 0.34 mg/dL in the maintenance HD group and 0.81 ± 0.047 mg/dL in controls. Serum uric acid levels were also significantly higher in both the CRF (6.59 ± 0.38 mg/dL) and HD (6.11 ± 0.13 mg/dL) groups than in healthy controls (4.47 ± 0.23 mg/dL; p = 0.0001).
Comparison of serum renal function parameters and bone-mineral metabolism biomarkers across healthy controls, pre-dialysis CRF patients, and maintenance HD patients.
| Parameter | Healthy Controls (n = 30) Mean ± SE (Min.–Max.) | Pre-dialysis CRF (n = 30) Mean ± SE (Min.–Max.) | Maintenance HD (n = 30) Mean ± SE (Min.–Max.) | p-value |
|---|---|---|---|---|
| Urea (mg/dL) | 31.0 ± 1.29 (17–44) | 137.7 ± 6.98 (54–384) | 122.0 ± 11.54 (85–215) | 0.0001 |
| Creatinine (mg/dL) | 0.81 ± 0.047 (0.4–1.3) | 6.97 ± 0.43 (1.4–8.1) | 3.58 ± 0.34 (1.85–13.0) | 0.0001 |
| Uric acid (mg/dL) | 4.47 ± 0.23 (2.6–7.0) | 6.59 ± 0.38 (2.5–12.6) | 6.11 ± 0.13 (4.40–7.55) | 0.0001 |
| Calcium (mg/dL) | 9.19 ± 0.11 (8.1–10.4) | 8.83 ± 0.108 (7.8–11.2) | 8.82 ± 0.107 (7.9–9.9) | 0.029 |
| Phosphorus (mg/dL) | 3.70 ± 0.20 (2.0–6.1) | 5.53 ± 0.32 (2.9–11.6) | 5.59 ± 0.19 (3.9–7.8) | 0.0001 |
| PTH (pg/mL) | 23.60 ± 1.62 (13.6–44.8) | 38.57 ± 3.56 (10.12–78.0) | 44.66 ± 9.24 (12.0–298.6) | 0.035 |
| Vitamin D (ng/mL) | 19.60 ± 1.90 (4.2–43.0) | 10.31 ± 1.09 (3.02–26.6) | 12.15 ± 0.80 (5.0–21.0) | 0.0001 |
| FGF-23 (pg/mL) | 134.7 ± 17.08 (68.5–605.4) | 153.3 ± 14.90 (76.82–503.66) | 216.5 ± 30.92 (64.83–723.71) | 0.027 |
Regarding bone and mineral metabolism markers, serum total calcium was modestly but significantly lower in both the CRF (8.83 ± 0.108 mg/dL) and HD (8.82 ± 0.107 mg/dL) groups compared with controls (9.19 ± 0.11 mg/dL; overall ANOVA p = 0.029). Conversely, serum phosphorus concentrations were markedly elevated in both the CRF (5.53 ± 0.32 mg/dL) and HD (5.59 ± 0.19 mg/dL) cohorts relative to healthy controls (3.70 ± 0.20 mg/dL; p = 0.0001).
Serum PTH levels were significantly elevated in the HD group (44.66 ± 9.24 pg/mL) compared with healthy controls (23.60 ± 1.62 pg/mL; post-hoc p = 0.012, overall ANOVA p = 0.035), consistent with secondary hyperparathyroidism, whereas the elevation in the pre-dialysis CRF group (38.57 ± 3.56 pg/mL) did not reach statistical significance compared with controls (post-hoc p = 0.071). Serum vitamin D concentrations were significantly depleted in both the CRF (10.31 ± 1.09 ng/mL) and HD (12.15 ± 0.80 ng/mL) groups compared with healthy controls (19.60 ± 1.90 ng/mL; p = 0.0001). Finally, serum intact FGF-23 levels were significantly higher in the maintenance HD cohort (216.5 ± 30.92 pg/mL) than in healthy controls (134.7 ± 17.08 pg/mL; post-hoc p = 0.011, overall ANOVA p = 0.027). However, serum FGF-23 levels in the pre-dialysis CRF group (153.3 ± 14.90 pg/mL) did not differ significantly from those of healthy controls (post-hoc p = 0.554).
Correlations between serum FGF-23 and study parameters
Pearson’s correlation analysis was conducted to examine the associations between circulating FGF-23 concentrations and other clinical and biochemical variables across the study population (Table 3). Serum FGF-23 demonstrated a moderate, highly significant positive correlation with serum PTH (r = 0.451, p = 0.0001) and a weak but statistically significant positive correlation with serum creatinine (r = 0.183, p = 0.042). In contrast, correlations between FGF-23 and age (r = −0.093, p = 0.191), BMI (r = 0.083, p = 0.219), urea (r = 0.133, p = 0.106), uric acid (r = 0.098, p = 0.178), calcium (r = 0.022, p = 0.417), phosphorus (r = 0.032, p = 0.384), and vitamin D (r = −0.110, p = 0.150) were weak and statistically non-significant. Notably, direct eGFR values were not included in the correlation matrix of the present analysis.
Pearson’s correlation analysis of serum FGF-23 concentrations with demographic, renal function, and bone-mineral parameters in the study cohort.
| Variable | Pearson’s Correlation Coefficient (r) with FGF-23 | p-value |
|---|---|---|
| Age (years) | −0.093 | 0.191 |
| BMI (kg/m²) | 0.083 | 0.219 |
| Urea (mg/dL) | 0.133 | 0.106 |
| Creatinine (mg/dL) | 0.183* | 0.042 |
| Uric acid (mg/dL) | 0.098 | 0.178 |
| Calcium (mg/dL) | 0.022 | 0.417 |
| Phosphorus (mg/dL) | 0.032 | 0.384 |
| Vitamin D (ng/mL) | −0.110 | 0.150 |
| PTH (pg/mL) | 0.451** | 0.0001 |
The positive correlation between FGF-23 and PTH underscores their closely coupled regulatory interplay in mineral homeostasis, particularly in the setting of CKD-associated secondary hyperparathyroidism9. Similarly, the positive association between FGF-23 and serum creatinine reflects progressive FGF-23 accumulation as renal filtration declines, whereas the lack of significant correlations with demographic and general metabolic indices suggests that circulating FGF-23 alterations in this cohort were primarily driven by renal and parathyroid dysfunction.
Diagnostic performance of mineral metabolism biomarkers
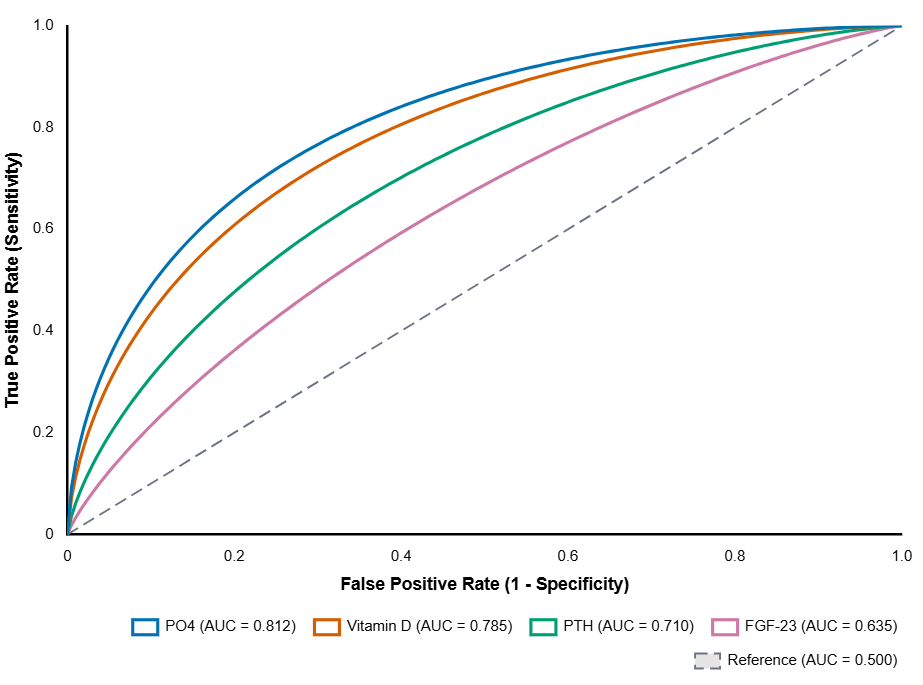
To evaluate the discriminatory performance of serum phosphorus (PO4), PTH, FGF-23, and vitamin D, ROC curve analyses were performed separately for pre-dialysis CRF patients versus healthy controls (Table 4, Figure 1) and for maintenance HD patients versus healthy controls (Table 5, Figure 2).
Receiver operating characteristic (ROC) curve analysis of serum bone-mineral biomarkers for discriminating pre-dialysis CRF patients from healthy controls.
| Biomarker | Area Under the Curve (AUC) | Specificity (%) | Sensitivity (%) | Optimal Cut-off Value | p-value |
|---|---|---|---|---|---|
| Phosphorus (PO4, mg/dL) | 0.812 | 80.0% | 76.7% | 4.25 | 0.0001 |
| PTH (pg/mL) | 0.710 | 73.3% | 66.7% | 23.50 | 0.001 |
| FGF-23 (pg/mL) | 0.635 | 83.3% | 43.3% | 142.10 | 0.025 |
| Vitamin D (ng/mL) | 0.785 | 90.0% | 63.3% | 16.80 | 0.0001 |
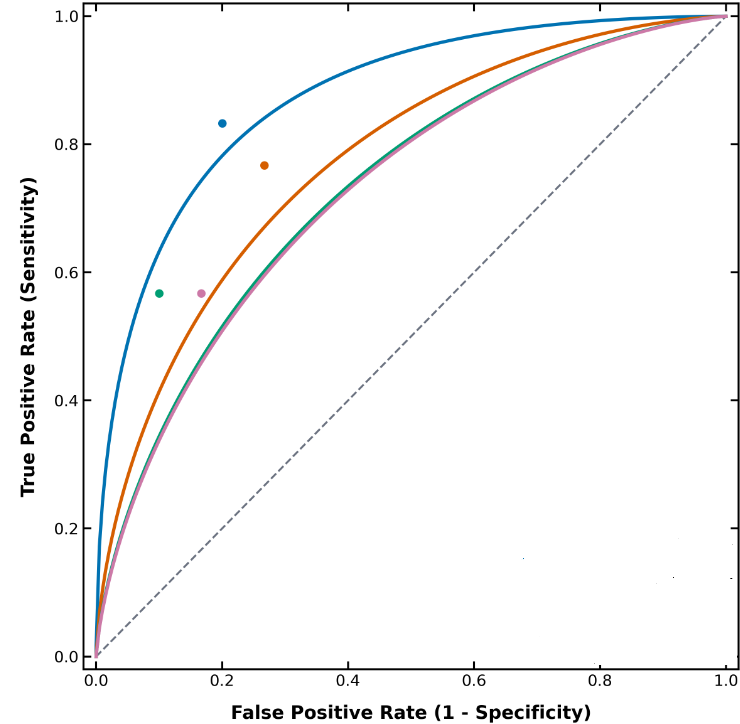
Serum phosphate and vitamin D outperform PTH and FGF-23 in discriminating pre-dialysis CRF patients from healthy controls. Receiver operating characteristic (ROC) curve analysis was performed on venous serum samples from pre-dialysis chronic renal failure (CRF) patients (n = 30) and age- and sex-matched healthy controls (n = 30) to evaluate the diagnostic sensitivity (true positive rate, y-axis) and 1 − specificity (false positive rate, x-axis) of serum mineral metabolism biomarkers. All four biomarkers significantly discriminated pre-dialysis CRF patients from healthy controls (p < 0.05): serum phosphate (PO4, blue solid curve) demonstrated the highest diagnostic accuracy with an area under the curve (AUC) of 0.812 (p = 0.0001; 76.7% sensitivity and 80.0% specificity at an optimal cut-off value of 4.25 mg/dL), followed by vitamin D (orange solid curve; AUC = 0.785, p = 0.0001; 63.3% sensitivity and 90.0% specificity at a cut-off value of 16.80 ng/mL), parathyroid hormone (PTH, green solid curve; AUC = 0.710, p = 0.001; 66.7% sensitivity and 73.3% specificity at a cut-off value of 23.50 pg/mL), and intact fibroblast growth factor-23 (FGF-23, pink solid curve; AUC = 0.635, p = 0.025; 43.3% sensitivity and 83.3% specificity at a cut-off value of 142.10 pg/mL). The diagonal dashed gray line represents the reference line of no discrimination (theoretical chance diagnostic boundary, AUC = 0.500). Abbreviations: AUC, area under the curve; CRF, chronic renal failure; FGF-23, fibroblast growth factor-23; PO4, phosphate/inorganic phosphorus; PTH, parathyroid hormone; ROC, receiver operating characteristic.
Receiver operating characteristic (ROC) curve analysis of serum bone-mineral biomarkers for discriminating maintenance HD patients from healthy controls.
| Biomarker | Area Under the Curve (AUC) | Specificity (%) | Sensitivity (%) | Optimal Cut-off Value | p-value |
|---|---|---|---|---|---|
| Phosphorus (PO4, mg/dL) | 0.874 | 80.0% | 83.3% | 4.45 | 0.0001 |
| PTH (pg/mL) | 0.774 | 73.3% | 76.7% | 25.10 | 0.0001 |
| FGF-23 (pg/mL) | 0.729 | 83.3% | 56.7% | 152.40 | 0.001 |
| Vitamin D (ng/mL) | 0.733 | 90.0% | 56.7% | 17.50 | 0.0001 |
Diagnostic performance of serum bone-mineral biomarkers in distinguishing maintenance hemodialysis (HD) patients from healthy controls. Receiver operating characteristic (ROC) curves were generated from pre-session serum biomarker measurements in maintenance HD patients (n = 30) compared against healthy controls (n = 30), plotting sensitivity (true positive rate, y-axis) against 1 − specificity (false positive rate, x-axis). Serum phosphate (PO4, blue solid curve) exhibited the highest discriminatory accuracy with an area under the curve (AUC) of 0.874 (p = 0.0001; 83.3% sensitivity and 80.0% specificity at an optimal cut-off value of 4.45 mg/dL), followed by parathyroid hormone (PTH, orange solid curve; AUC = 0.774, p = 0.0001; 76.7% sensitivity and 73.3% specificity at a cut-off value of 25.10 pg/mL), vitamin D (green solid curve; AUC = 0.733, p = 0.0001; 56.7% sensitivity and 90.0% specificity at a cut-off value of 17.50 ng/mL), and intact fibroblast growth factor-23 (FGF-23, pink solid curve; AUC = 0.729, p = 0.001; 56.7% sensitivity and 83.3% specificity at a cut-off value of 152.40 pg/mL). Colored circular markers indicate the optimal cut-off operating points for the respective biomarkers, and the diagonal dashed gray line indicates the theoretical chance diagnostic boundary (AUC = 0.500). Abbreviations: AUC, area under the curve; FGF-23, fibroblast growth factor-23; HD, hemodialysis; PO4, phosphate/inorganic phosphorus; PTH, parathyroid hormone; ROC, receiver operating characteristic.
In the pre-dialysis CRF versus healthy control comparison (Table 4, Figure 1), serum phosphorus demonstrated the highest diagnostic accuracy with an AUC of 0.812 (p = 0.0001; 76.7% sensitivity and 80.0% specificity at a cut-off value of 4.25 mg/dL), followed by vitamin D with an AUC of 0.785 (p = 0.0001; 63.3% sensitivity and 90.0% specificity at a cut-off value of 16.80 ng/mL), PTH with an AUC of 0.710 (p = 0.001; 66.7% sensitivity and 73.3% specificity at a cut-off value of 23.50 pg/mL), and FGF-23 with an AUC of 0.635 (p = 0.025; 43.3% sensitivity and 83.3% specificity at a cut-off value of 142.10 pg/mL).
In the maintenance HD versus healthy control comparison (Table 5, Figure 2), diagnostic performance improved across the hormonal markers. Serum phosphorus again exhibited the highest discriminatory accuracy with an AUC of 0.874 (p = 0.0001; 83.3% sensitivity and 80.0% specificity at a cut-off value of 4.45 mg/dL), followed by PTH with an AUC of 0.774 (p = 0.0001; 76.7% sensitivity and 73.3% specificity at a cut-off value of 25.10 pg/mL), vitamin D with an AUC of 0.733 (p = 0.0001; 56.7% sensitivity and 90.0% specificity at a cut-off value of 17.50 ng/mL), and FGF-23 with an AUC of 0.729 (p = 0.001; 56.7% sensitivity and 83.3% specificity at a cut-off value of 152.40 pg/mL).
Discussion
Physiological aging is accompanied by a gradual decline in GFR, a primary parameter for diagnosing and staging CKD. Older adults are particularly susceptible to CKD due to cumulative genetic, environmental, and cellular senescence factors that accelerate nephron loss10. Previous comparative outcomes research in elderly patients with advanced CKD has suggested that conservative management may yield survival rates comparable or superior to dialysis initiation in patients with high comorbidity burdens11. Regarding sex differences, epidemiological data indicate that women generally have a lower risk of progressing to ESRD than men, with an adjusted hazard ratio of 0.84 after accounting for age and comorbidities2. Men are more likely to initiate RRT due to a more rapid decline in renal function, potentially mediated by androgen-related deleterious effects on renal hemodynamics and lifestyle risk factors12. In our cross-sectional cohort, female participants constituted a slightly higher proportion of the CRF (60.0%) and HD (56.7%) groups; however, sex distribution did not differ significantly across the three study groups, likely reflecting the modest sample size and single-center recruitment design.
With respect to adiposity, lower BMI in advanced CKD has been associated with increased progression to ESRD and higher mortality, whereas higher BMI has been linked to improved survival in certain advanced CKD and maintenance HD populations—a phenomenon termed the 'obesity paradox'—despite conferring an elevated risk of cardiovascular events13,14. Conversely, our cross-sectional findings demonstrated significantly higher mean BMI values and a high prevalence of obesity in both the pre-dialysis CRF (80.0%) and HD (86.7%) groups compared with healthy controls (33.4%). This observation aligns with established pathophysiological evidence that obesity is a major primary risk factor for the development and progression of CKD via its close association with metabolic syndrome, systemic hypertension, and type 2 diabetes mellitus, even though its prognostic association with survival may become complex in late-stage disease15.
In patients with CRF, declining nephron mass impairs the clearance of nitrogenous waste products, resulting in pronounced elevations in serum urea and creatinine concentrations that frequently exceed 200 mg/dL for urea and rise several-fold above reference intervals for creatinine16. Maintenance hemodialysis effectively reduces circulating urea and creatinine concentrations across individual dialysis sessions, as consistently demonstrated by prospective pre- versus post-dialysis comparisons17,18. Unlike longitudinal intradialytic clearance studies, our cross-sectional evaluation demonstrated a lower mean pre-dialysis serum creatinine level in the maintenance HD cohort (3.58 ± 0.34 mg/dL) than in the pre-dialysis CRF cohort (6.97 ± 0.43 mg/dL). This difference likely reflects variations in residual renal function, skeletal muscle mass and nutritional status, and steady-state interdialytic solute kinetics between patients managed conservatively and those established on regular thrice-weekly hemodialysis. Similarly, elevated serum uric acid (UA) is recognized as an independent risk factor for renal function decline, cardiovascular events, and all-cause mortality in early-stage CKD19, and maintenance HD plays an important role in clearing circulating UA to mitigate hyperuricemia20.
Chronic kidney disease–mineral and bone disorder (CKD-MBD) represents a pervasive systemic complication in advanced renal failure and maintenance HD populations. Previous clinical investigations have reported a high prevalence of hypocalcemia among regular HD patients—with up to 60% exhibiting serum calcium levels below 8.4 mg/dL—driven largely by phosphate retention rather than uremia alone21. Our findings corroborate this pattern, demonstrating significantly lower serum calcium concentrations alongside marked hyperphosphatemia in both the pre-dialysis CRF and HD groups compared with healthy controls. Other clinical studies of HD cohorts have likewise documented disturbed calcium–phosphorus homeostasis accompanied by a high prevalence (58.5%) of secondary hyperparathyroidism22. Furthermore, anthropometric and nutritional indices such as BMI and blood urea nitrogen (BUN) have been identified as significant predictors of hyperphosphatemia in HD patients, underscoring the necessity of dietary phosphate restriction and individualized nutritional management23. Because maintenance dialysis patients frequently exhibit higher serum phosphorus concentrations than non-dialysis CKD patients, integrated therapeutic strategies combining dietary counseling, adequate dialysis clearance, and pharmacological phosphate binders are generally required24.
Parathyroid hormone is a principal regulator of skeletal remodeling and mineral ion transport, and its sustained elevation in CKD drives high-turnover bone disease and extraskeletal calcification25. Beyond skeletal pathology, elevated PTH levels in HD patients have been linked to renal anemia through bone marrow fibrosis and consequent hyporesponsiveness to erythropoiesis-stimulating agents (ESAs)26. Concurrently, vitamin D insufficiency and deficiency are widespread among CKD and HD cohorts. For instance, a study conducted at the Tripoli Dialysis Center reported vitamin D insufficiency in 37% and frank deficiency in 30% of HD patients27, while an investigation in Abidjan found vitamin D deficiency (< 20 ng/mL) in 16% of supplemented HD patients28. Consistent with these reports, both our pre-dialysis CRF and HD cohorts exhibited severe vitamin D depletion (mean levels of 10.31 and 12.15 ng/mL, respectively), which directly contributes to impaired intestinal calcium absorption, secondary hyperparathyroidism, and the progression of CKD-MBD29.
Fibroblast growth factor-23 is central to the adaptive regulation of phosphate homeostasis in CKD. As functional nephron mass declines, osteocytic FGF-23 secretion rises early to augment fractional urinary phosphate excretion and counteract phosphate retention. Together with PTH, elevated FGF-23 participates in the complex pathogenesis of renal osteodystrophy and abnormal bone turnover30. Clinically, elevated circulating FGF-23 concentrations in CKD and HD patients are independently associated with left ventricular hypertrophy (LVH), incident heart failure, and overall cardiovascular morbidity and mortality, with residual kidney function modulating the magnitude of these risks31,32. In agreement with prior studies demonstrating marked elevations of biologically active intact FGF-23 in patients receiving maintenance HD33, our study found significantly higher serum FGF-23 levels in the HD group than in healthy controls. Systemic inflammation in CKD has also been shown to stimulate FGF-23 production and alter its cleavage dynamics, an association that is particularly pronounced for intact FGF-23 compared with C-terminal fragments34. Mechanistically, FGF-23 suppresses renal 1α-hydroxylase (CYP27B1) and induces 24-hydroxylase (CYP24A1), thereby reducing 1,25-dihydroxyvitamin D synthesis. Moreover, clinical evidence indicates that circulating FGF-23 is significantly elevated in CKD patients with concurrent vitamin D deficiency, reflecting a compensatory drive to offload phosphate despite low vitamin D reserves35. Although both FGF-23 and PTH rise progressively as GFR declines, FGF-23 fails to inhibit parathyroid PTH secretion in advanced kidney failure due to the downregulation of parathyroid α-Klotho–FGFR1c receptor complexes, resulting in maladaptive secondary hyperparathyroidism36.
Several limitations of the present study warrant consideration. First, the absolute serum FGF-23 concentrations observed in our pre-dialysis CRF and HD cohorts exhibited partial range overlap with healthy controls and were lower than the extreme elevations (often exceeding thousands of pg/mL) classically reported in end-stage renal disease. This discrepancy may be attributable to the specific epitope recognition profile and calibration range of the ELISA kit employed, pre-analytical sample handling and storage conditions, or differences in analytical cross-reactivity between intact FGF-23 and C-terminal FGF-23 fragments. Second, the cross-sectional, single-center design and modest sample size precluded causal inference and longitudinal evaluation of clinical endpoints. Finally, individual patient eGFR values and urinary fractional phosphate excretion measurements were not incorporated into the correlation models.
Conclusion
This study demonstrates a significant elevation in circulating intact FGF-23 concentrations among maintenance hemodialysis patients compared with healthy controls, alongside pronounced hyperphosphatemia, hypocalcemia, vitamin D depletion, and elevated PTH levels. Serum FGF-23 correlated moderately with PTH and weakly with serum creatinine across the study cohort, but showed no significant direct correlation with serum phosphorus or calcium, and did not differ significantly between pre-dialysis CRF patients and healthy controls. Collectively, these findings support a close association between circulating FGF-23 and markers of renal impairment and secondary hyperparathyroidism in advanced kidney disease, particularly among patients undergoing maintenance hemodialysis. Larger, multicenter longitudinal studies utilizing standardized intact and C-terminal FGF-23 assays are warranted to further delineate its diagnostic and prognostic utility across the spectrum of CKD.
Abbreviations
ANOVA: Analysis of variance; AUC: Area under the curve; BMI: Body mass index; BUN: Blood urea nitrogen; CKD: Chronic kidney disease; CKD-MBD: Chronic kidney disease–mineral and bone disorder; CRF: Chronic renal failure; CT: Computed tomography; CVD: Cardiovascular disease; ECL: Electrochemiluminescence; eGFR: Estimated glomerular filtration rate; ELISA: Enzyme-linked immunosorbent assay; ESA: Erythropoiesis-stimulating agent; ESKD: End-stage kidney disease; ESRD: End-stage renal disease; FGF-23: Fibroblast growth factor-23; GFR: Glomerular filtration rate; HD: Hemodialysis; iFGF-23: Intact fibroblast growth factor-23; LVH: Left ventricular hypertrophy; PO4: Phosphate / Inorganic phosphorus; PTH: Parathyroid hormone; ROC: Receiver operating characteristic; RRT: Renal replacement therapy; SE: Standard error; SPSS: Statistical Package for the Social Sciences; SUA: Serum uric acid; UA: Uric acid.
Acknowledgments
The authors would like to thank the research consultants for their valuable guidance. The authors also express their gratitude to the University of Al-Maarif (Anbar, Iraq) for providing the laboratory facilities required to complete the experimental work of this study.
Author’s contributions
AAR contributed to conceptualization, methodology, validation, formal analysis, resources, visualization, supervision, project administration, writing–original draft, and writing–review and editing. HHA contributed to conceptualization, methodology, software, validation, investigation, resources, data curation, and supervision. SMM contributed to participant recruitment and selection, data curation, and writing–review and editing. All authors read and approved the final manuscript and agreed with the results and conclusions.
Funding
None. This work received no external funding.
Availability of data and materials
The datasets supporting the findings and conclusions of this study are available from the corresponding author upon reasonable request.
Ethics approval and consent to participate
This study was reviewed and approved by the Institutional Review Board of the College of Medicine at Al-Nahrain University (Approval No. 20231005). Written informed consent was obtained from all participants prior to enrollment.
Consent for publication
None.
Declaration of generative AI and AI-assisted technologies in the writing process
None.
Competing interests
None. The authors declare that they have no competing interests.