

Apolipoprotein E gene polymorphism influenced glycemic status among Malaysians
- Department of Basic Medical Sciences, Kulliyyah of Pharmacy, International Islamic University, 25200 Kuantan, Pahang, Malaysia
- Department of Pharmacology and Therapeutics, Sylhet Women’s Medical College, Sylhet, Bangladesh
- Department of Biomedical Sciences, Kulliyyah of Allied Health Sciences, International Islamic University Malaysia, 25200 Kuantan, Pahang, Malaysia
- Department of Biological Sciences, Faculty of Science, Sristy College of Tangail, 1900 Tangail, Bangladesh
- Department of Oral Biology and Biomedical Sciences, Faculty of Dentistry, MAHSA University, Selangor, Malaysia
- Kulliyyah of Medicine, International Islamic University, 25200 Kuantan, Pahang, Malaysia
Abstract
Aim: In the last decade Apolipoprotein E (APOE) gene polymorphism has been identified as one of the risk factors of type 2 diabetes mellitus (T2DM). Though more than 11% population of Malaysia are suffering from T2DM, there is inadequate data on the correlation between the APOE gene polymorphism and pathogenesis of diabetes among Malaysians. Hence, in this study we aimed to find out the association between the frequencies of APOE allele and fasting blood glucose (FBG) concentration among subjects with T2DM.
Methods: A total of 102 subjects were recruited into two distinct groups, 51 in diabetes (cases) and 51 in non-diabetes (control) group. Their fasting blood sample was tested for FBG, while APOE genotyping was carried out using restriction fragment length polymorphism technique. Predictive Analytics Software (PASW) statistics, version 18.0, was used for statistical analyses.
Results: There was no association between APOE alleles and T2DM; odd ratios for the e2, e3 and e4 alleles were 1.51 (95%CI: 0.615-3.706), 0.77 (95%CI: 0.431-1.375) and 1.12 (95%CI: 0.584-2.131) respectively. The highest mean FBG was found in subjects with e2 alleles, followed by e4 and e3 alleles in both cases and control groups. Both e2 and e4 alleles were significantly linked to higher mean FBG (p=0.03 and 0.04 for the respectively) compared to e3 allele in diabetes group.
Conclusions: Although the APOE gene was not found to be associated with T2DM, it may influence glycemic status among subjects.
Introduction
Diabetes is a chronic metabolic disease that affects 9% of adults all around the world 1. It is one of the major causes of morbidity and mortality among adults. In Malaysia, as per National Health and Morbidity Survey report 2015, prevalence of diabetes among adults of age 18 years and above is 17.5% 2. While World Health Organization (WHO), in the ‘Global Status Report on Noncommunicable Diseases 2014’, reported that the prevalence of diabetes among Malaysian adults is 11.1%, which is 1.2 times higher than the global prevalence1.
From the genetic point of view, the causes of diabetes can be divided into monogenic and polygenic disease. Usually, the monogenic defects cause type 1 diabetes mellitus (T1DM) by affecting the production of insulin from beta cells of pancreas, and it contributes to 1-5% cases of all diabetes 3. On the other hand, type 2 diabetes mellitus (T2DM) that contributes 90-95% of all diabetes, is a chronic multifactorial disease of adulthood 3,4. T2DM results from a complex interactions between multiple genetic and environmental factors, where pre-existing susceptible genes are being triggered by nongenetic environmental factors, such as consumption of junk food, decreased opportunity and motivation for physical activity, and awareness among the genetically susceptible individuals 5,6.
About a decade ago, the apolipoprotein E (APOE) gene was suggested as a susceptible gene that could induce pathogenesis of T2DM 7. Apolipoprotein E (apoE) is a small glycoprotein 8 with the molecular weight of 34 kDa 9, and is mainly secreted from the liver 10. The primary role of circulating apoE is to facilitate the interaction of chylomicron remnants and intermediate density lipoproteins (IDL) with lipoprotein receptors, namely the low-density lipoprotein (LDL) receptors (LDLr), and the chylomicron remnants or apoE receptors10,11. It also promotes the efficient uptake of these lipoproteins from the circulation and takes part in cellular cholesterol efflux and reverse cholesterol transportation 12. Concentration of plasma apoE and its binding capability is regulated by the APOE gene, which is located in the long arm of chromosome 19, more precisely at 19q13.2 13. APOE gene possesses three alleles, namely e2, e3 and e4, which are responsible for the production of corresponding E2, E3 and E4 plasma isoproteins 7. The APOE gene is polymorphic in nature with having six genotypes, three of which are homozygous (e2/e2, e3/e3 and e4/e4) and three are heterozygous (e2/e3, e2/e4 and e3/e4) 14. Variations in the plasma apoE are due to cysteine–arginine interchanges in the chemical structure. ApoE3 contains a cysteine residue at 112 and an arginine residue at 158, while apoE2 contains cysteine residues at the both positions, and apoE4 contains arginine residue at the both positions 11,15. Corresponding single nucleotide polymorphisms at the genetic level is involved in the modification of amino acid sequences at the protein level 16.
Several studies on the role of APOE gene in developing pathological conditions of diabetes have been conducted and the pathogenesis was further linked to lipid and lipoprotein metabolic abnormalities17,18,19,20,21. However, there are scarcity of similar studies on Malaysian populations. Hence, in this study we aimed to evaluate the relationship between APOE gene polymorphism and T2DM among Malaysian subjects.
Methods
Ethical approval
The declaration of Helsinki was strictly followed in this study. Ethical approval (Ref. IIUM/305/20/4/10) was obtained from the International Islamic University (IIUM) Ethics Committee. Moreover, signed informed written consent was also collected from the participants prior to blood collection.
Sample selection
A total of 102 study subjects were recruited in this case–control study. 51 subjects with uncontrolled T2DM were enrolled as case and 51 subjects without T2DM were enrolled as control. Only Malaysian subjects aged 40 years or above were recruited. The groups were matched for age (±10 years) and ethnicity. Any ongoing treatments or medications of the study subjects were not stopped for this research.
Collection of blood
After an initial interview, fasting (at least 8 hours, overnight) blood samples were collected into two vacutainers. Plasma was separated from blood shortly after collection and stored at -80C until further analysis. Ethylenediaminetetraacetic acid (EDTA) vacutainers containing whole blood sample were also stored at the same temperature for genotyping.
Fasting blood glucose analysis
The fasting blood glucose concentration was measured according to the glucose oxidase method using Bayer Express Plus Chemistry Analyzer (model: 550, Bayer Diagnostic, Siemens, USA). The standard laboratory protocol for the machine was followed.
Apolipoprotein E gene polymorphism analysis
Genomic DNA was extracted from 200 ml of human whole blood using Invisorb Spin Blood Mini Kit (Stratec Molecular Gmbh, Germany) following the manufacturer’s protocol. Three common alleles of the APOE gene were amplified by polymerase chain reaction (PCR) using TopTaq Master Mix Kit (QIAGEN, Germany). The final reaction volume was 25 ml for each sample, which consisted of 1.25 units TopTaq DNA polymerase, 1x PCR buffer solution, 3 mM MgCl and 200 mM of each dNTP and 5 ml of the genomic DNA. Concentration of each primer (forward: 5’-TAA GCT TGG CAC GGC TGT CCA AGG A-3’ and reverse: 5’-ACA GAA TTG GCC CCG GCC TGG TAC AC-3’; Invitrogen, USA) in the final reaction volume was 0.5 mM. Molecular grade glycerol (10% in each final reaction volume) was used due to high melting temperature of the selected primers. The PCR operation conditions included initial denaturation phase at 95C for 5 minutes, followed by 30 cycles of denaturation at 95C for 30 seconds, annealing at 60C for 20 seconds, extension phase at 72C for 20 seconds, and the final elongation at 72C for 10 minutes. Amplification was confirmed by 1% agarose gel electrophoresis stained with ethidium bromide. After confirmation of amplification, 10 ml of each amplified DNA was then digested at 37C for an hour by HhaI restriction enzyme (Invitrogen, USA). The digested products were then visualized in 4% agarose gel stained with ethidium bromide. A single band of about 244 base pairs (bp) in 1% agarose gel was considered confirmatory to the amplification (Figure 1). Seven bands at different levels were identified in 4% agarose gel after the digestion, the first four bands were used to identify different APOE genotypes based on their presence/absence at the identical bp levels (Figure 1). The presence of the first two bands (at 94 and 81 bp) was used to identify the e2/e2 genotype, first two and fourth bands (at 94, 81 and 66 bp) represented e2/e3 genotype, all four bands (at 94, 81, 66 and 58 bp) represented the e2/e4 genotype, first and fourth bands (at 94 and 58 bp levels) represented the e3/e3 genotype, first and last two bands (at 94, 66 and 58 bp levels) represented the e3/e4 genotype, and last two bands (at 66 and 58 bp levels) represented the e4/e4 genotypes.
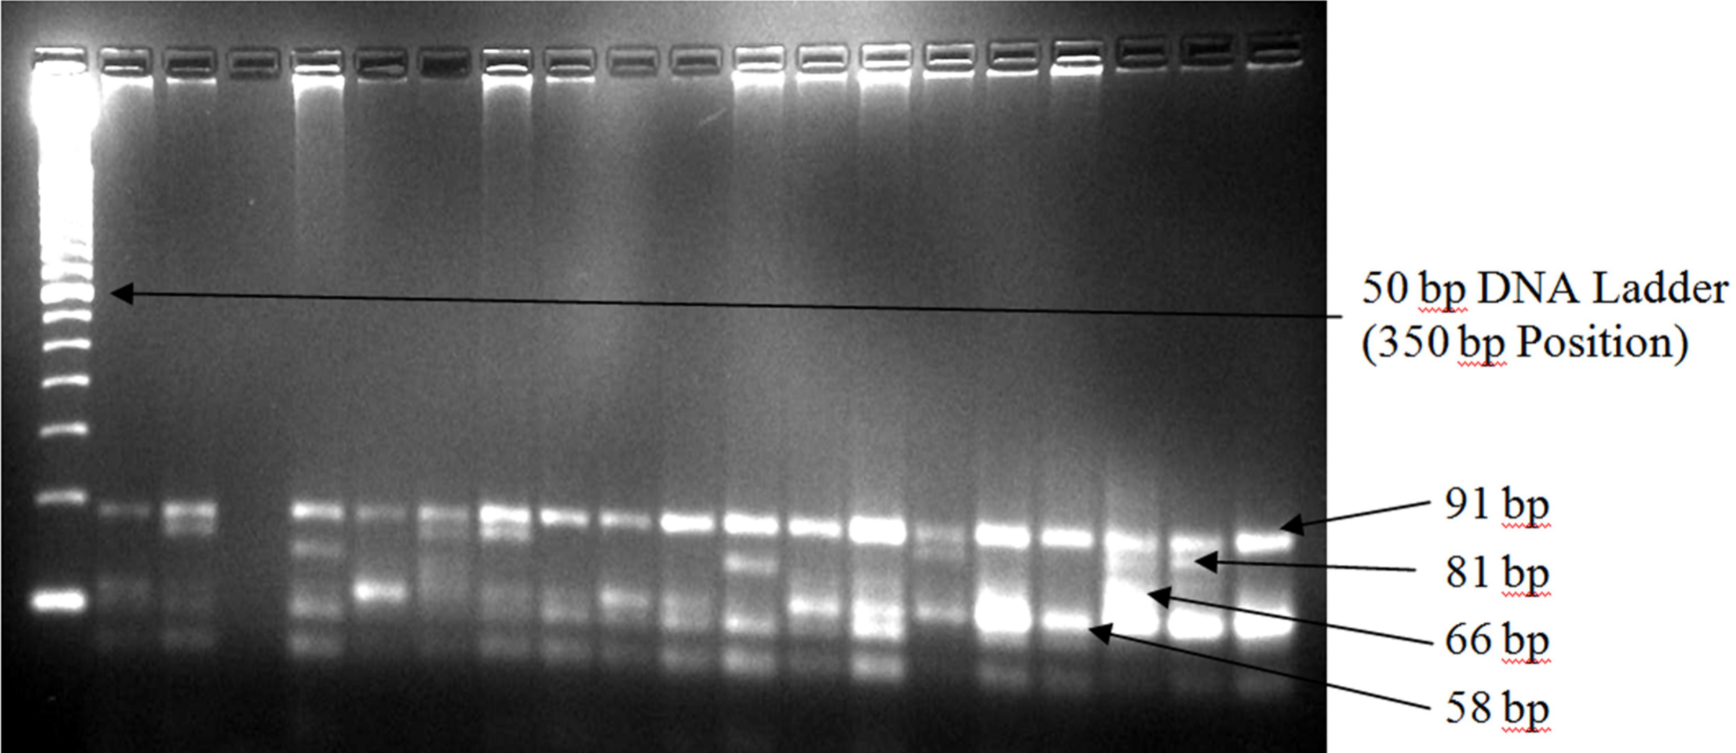
Different diagnostic band after
Statistical analysis
Predictive Analysis SoftWare (PASW) version 18 was used for data analyses. A p-value of <0.05 at 95% confidence interval was considered as statistically significant. Categorical data were compared by using Pearson chi–squared (χ) test. Comparisons between categorical and numerical data were performed using one-way analysis of variance (ANOVA) followed by Tukey’s post-hoc test. Distribution of the APOE gene polymorphism was tested for the Hardy-Weinberg equilibrium. The data were presented as mean ± standard deviation (SD).
Results
Demographic characteristics of the study subjects showed no significant difference
The demographic characteristics of the study subjects are shown in Table 1. Distributions based on the ethnicity, gender, mean age and different age groups were similar between the groups (p-values were 1.00, 0.23, 0.35 and 0.33, respectively). Mean systolic and diastolic blood pressures (BP) were not significantly different between the groups (p-values were 0.49 for systolic and 0.41 for diastolic BP).
Demographic characteristics of the study subjects
| Non-diabetes | Diabetes | |
| Ethnicity | ||
| Malay | 24 (47.1) | 24 (47.1) |
| Chinese | 27 (52.9) | 27 (52.9) |
| Gender | ||
| Male | 26 (51) | 32 (62.7) |
| Female | 25 (49) | 19 (37.3) |
| Age groups | ||
| 40 – 49 years | 1 (2.0) | 1 (2.0) |
| 50 – 59 years | 5 (9.8) | 7 (13.7) |
| 60 – 69 years | 18 (35.3) | 17 (33.3) |
| 70 – 79 years | 15 (29.4) | 22 (43.1) |
| 80 – 89 years | 8 (15.7) | 3 (5.9) |
| > 90 years | 4 (7.8) | 1 (2.0) |
| Mean age | 69.2 (9.6) | 71.1 (11.3) |
| Blood Pressure | ||
| Systolic | 134.58 (18.76) | 131.81 (10.13) |
| Diastolic | 82.55 (16.59) | 79.52 (10.52) |
| Fasting Blood Glucose | 4.91 (0.83) | 9.21 (2.21) |
Distribution of the Apolipoprotein E gene polymorphism
Distribution based on the APOE genotypes and alleles were shown in Table 2. Five out of six (except e2/e2 genotype) APOE genotypes were identified in the study samples. The highest prevalence was observed for the e3/e3 genotypes in both cases and control groups, followed by e3/e4, e2/e4, e2/e3, and e4/e4 genotypes. Though there was no significant difference in the prevalence of genotypes, percentage of e3/e3 genotype was slightly lower, while e2/e3 and e4/e4 genotypes were marginally higher among the subjects with T2DM compared to the subjects without T2DM. e3 allele was observed with the highest percentage followed by e4 allele and e2 allele in both groups. Similar to genotypes, no significant difference in the frequencies of alleles were observed. However, the percentage of both e2 and e4 alleles were slightly higher and e3 allele was slightly lower in the diabetes group compared to the control group. Similar results were also observed when the samples were subdivided based on their ethnicity. However, the changes were too small to reach the level of statistical significance using the Pearson chi-squared test (p=0.58 for APOE genotypes and alleles, 0.91 for the Malay study subjects and 0.46 for the Chinese study subjects). When the samples were tested for the Hardy-Weinberg equilibrium, samples within the diabetes group, both the Malays and Chinese, followed equilibrium. But the distribution in non-diabetes group was found to be significantly (p=0.0007) deviated from equilibrium; more specifically within the Malay subjects (p=0.0002). Within the non-diabetes group, allelic distribution was significantly different between the Malay and Chinese subjects (p=0.03). The e3 allele was less prevalent among Malay subjects (56.2%) compared to Chinese subjects (79.6%) in the control group. Meanwhile, the e4 allele was almost double and e2 allele was four times more prevalent in the Malay control subjects compared to Chinese controls.
Distribution of different APOE genotypes and alleles among the study subjects
| Genotype | Non-diabetesno. (%) | Diabetesno. (%) |
| e2/e2 | 0 (0.0) | 0 (0.0) |
| e2/e3 | 2 (3.9) | 6 (11.8) |
| e2/e4 | 7 (13.7) | 7 (13.7) |
| e3/e3 | 27 (52.9) | 22 (43.1) |
| e3/e4 | 14 (27.5) | 14 (27.5) |
| e4/e4 | 1 (2.0) | 2 (3.9) |
| Total | 51 (100) | 51 (100) |
| Alleles | ||
| e2 | 9 (8.8) | 13 (12.7) |
| e3 | 70 (68.6) | 64 (62.8) |
| e4 | 23 (22.6) | 25 (24.5) |
Test for the association between APOE and T2DM also did not show any significant difference. Odd ratio between e2 allele and others was 1.51 (95% CI=0.615-3.706, p=0.37), between e3 allele and others was 0.77 (95% CI=0.431-1.375, p=0.38), and between e4 allele and others was 1.12 (95% CI=0.584-2.131, p=0.74).
Apolipoprotein E gene polymorphism and fasting glycemic status
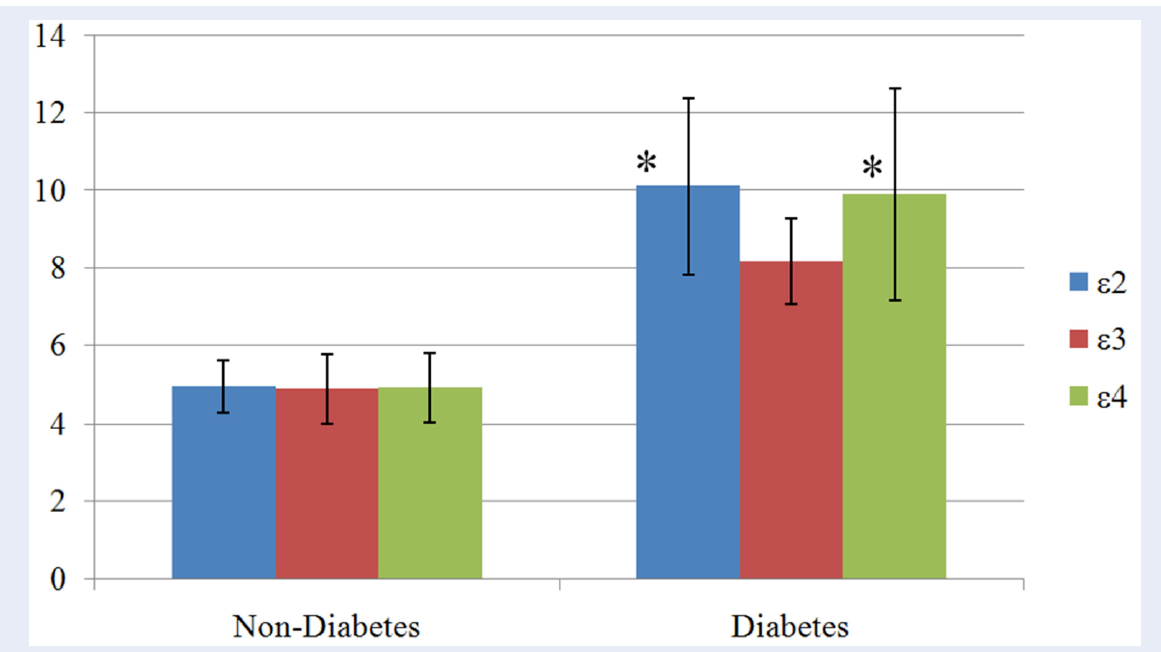
Means of the FBG (±SD) in relation to different APOE alleles between the study groups are shown in Figure 2. In both the study groups, e2 allele holds the highest mean FBG values followed by e4 and then e3 alleles. Mean differences were found to be statistically significant between alleles in diabetes group (p = 0.011), but not in the control group (p = 0.978). Within the diabetes group, both the e2 and e4 alleles had significantly higher mean FBG compared to e3 allele, p = 0.026 and 0.036, respectively.

Difference in mean FBG values (± Standard Deviation) in relation to the APOE alleles distribution within the non–diabetes and the diabetes study subjects. Mean differences in FBG concentration were statistically significant between alleles in the diabetes group (p = 0.011), but not in the control group (p = 0.978). Within the diabetes group, mean FBG concentration was significantly higher in both the e2 (p= 0.026) and e4 (p=0.036) alleles compared to the e3 allele. (* = significant difference compared to the e3 allele.)
Discussion
In this study, the distribution of APOE gene polymorphism did not show any significant difference between cases and control groups. However, Hardy-Weinberg equilibrium test showed a significant difference in the allelic distribution between the Malay and Chinese race of non-diabetic subjects. Distribution of e2 and e4 alleles in Malay control subjects compared to Chinese controls was four and two times higher, respectively. Like Malay subjects, comparatively higher frequency of e4 allele was also observed in Indonesian populations, and certain parts of African, European and Oceania countries 22,23,24,25,26,27. This finding is also consistent with two studies conducted in Singapore, where Malay aboriginal subjects were recruited 28,29. On the other hand, the distribution of APOE alleles within Chinese subjects follows the worldwide APOE distribution 30, including the part of China, Japan, Taiwan and Korea13,21,31. Certain European countries also demonstrated similar distribution26,32. According to Corbo and Scacchi (1999), APOE e3 allele is the most frequent among populations that have a long established agricultural economy, and e4 allele remains higher in populations where an economy of foraging still exists and food supply is, or was in the recent past, scarce and sporadically available30.
There was no significant association between APOE alleles and T2DM in this study. It is noteworthy to mention that the percentages of the e2 and e4 alleles were slightly higher among the subjects with T2DM. Meanwhile, among the subjects with T2DM, mean FBG concentration was found significantly higher in subjects with e2 and e4 alleles compared to subjects with e3 allele. Similarly, the highest mean FBG was observed within e2 allelic control subjects, followed by e4 and the e3 allelic control subjects. Although plasma apoE protein does not have any direct effects on carbohydrate metabolism, its role in the development of obesity that eventually leads to the development of metabolic syndrome and insulin resistance had already been explored 33. Sima et al. reported a weak correlation between e4 allele with metabolic syndrome34. Whereas, Helkala et al. reported that e2-allele-carrying subjects had relatively higher fasting and 2-h blood glucose than the subject carrying other phenotypes35. Duman et al. also reported similar observation in a Turkish study population with T2DM 36.
Numerous studies have been conducted around the world regarding the relationship between the APOE gene polymorphism and diseases that are caused by or lead to dyslipidemia37,38,39,40,41. It was initiated by exploring the role of the e2 allele (more specifically the e2/e2 genotype) in the pathogenesis of type III hyperlipidemia that could leads to premature coronary artery disease37. Subsequent studies discovered the role of e4 allele on the pathogenesis of Alzheimer’s diseases, atherosclerosis and cerebrovascular diseases as well38,39,40,41. A number of studies also tried to find out a relationship between APOE gene polymorphism with T2DM and its complications. However, most of the studies were inconclusive. Only Liu et al. and Errera et al. suggested e2 allele as a risk factor for the development of T2DM in the Chinese and Brazilian populations17,18. The e2 allele was also reported to be associated with T2DM mediated nephropathy19,20,21. Increased risk of retinopathy in patients with T2DM was linked to the higher e4 allele frequency42. Most recently, Anthopoulos et al. conducted a meta-analysis, where they suggested the e2 allele as a moderate risk factor for the T2DM43.
Almost all studies were conducted to prove a causal relationship between APOE gene polymorphism and the risk of T2DM faced sample scarcity. However, original research and meta-analysis that reported a causal relationship between them recruited subjects with T2DM along with its complications, such as diabetic nephropathy, diabetic retinopathy, and/or diabetes with IHD, stroke etc.19,20,21,42,43. Similar to other previous studies, small sample size might be a cause behind the failure to find any association between APOE gene polymorphism and T2DM in this study. The subjects included in the study were free from any other diabetes mediated complications. But this study has generated a hypothesis on the causal relationship between APOE gene polymorphism and FBG concentration among the subjects with or without the T2DM.
Conclusions
Though this study represents preliminary data, it showed that subjects carrying e2 and e4 APOE alleles have poor glycemic control. Frequencies of these two alleles were also slightly higher among the subjects with T2DM. The e3 allelic subjects were found relatively safe in terms of the glycemic control and the occurrence of the T2DM. Further study with a larger sample size could help to improve the outcome of this research along with a proper conclusive causal relationship.
Abbreviations
ANOVA: Analysis of variance
APOE: Apolipoprotein E gene
apoE: Apolipoprotein E glycoprotein
bp: Base pair
EDTA: Ethylenediaminetetraacetic acid
FBG: Fasting blood glucose
IDL: Intermediate density lipoprotein
LDL: Low-density lipoprotein
LDLr: Low-density lipoprotein receptors
PASW: Predictive Analytics Software
PCR: Polymerase chain reaction
SD: Standard deviation
T1DM: Type 1 diabetes mellitus
T2DM: Type 2 diabetes mellitus
WHO: World Health Organization
Competing Interests
Authors declare no conflict of interests.
Authors' Contributions
KMHR and TBAR conceptualized and designed the work. KMHR carried out the experiment. KMHR and MSH conducted formal analysis. KMHR, MSH, NH, TBAR and HA prepared the original draft. MSH and NH reviewed and edited the drafts. All authors approved the manuscript.
Funding
This study was financially supported by the IIUM University Research Grant, EDW B 11-139-0478.
Acknowledgments
We extremely liked to acknowledge the supports from the Non-Communicable Disease Research Unite (NCD_RU), Kulliyyah of Medicine, International Islamic University Malaysia and the intellectual supports from the coordinator of the NCD_RU, Dr. Seikh Farid Uddin Akter.