


The value of the Global Registry of Acute Coronary Events and Gensini scores in predicting long-term outcomes in Vietnamese patients with non-ST-elevation acute coronary syndrome
- Department of Internal Medicine, Faculty of Medicine, University of Medicine and Pharmacy at Ho Chi Minh City, Ho Chi Minh City, Viet Nam
- Department of Cardiology, Cho Ray hospital, Ho Chi Minh City, Viet Nam
- Department of Cardiology, Tien Giang Hospital, Tien Giang, Viet Nam
- Department of Biostatistic, Virginia Commonwealth University School of Medicine, Virgnia, USA
- Department of Cardiology Intervention. Cho Ray Hospital, Ho Chi Minh City, Viet Nam
Abstract
Introduction: Patients with non-ST-elevation acute coronary syndrome (NSTE-ACS) should undergo risk stratification as soon as possible after their presentation. Early risk satisfaction provides good prognosis for patients as well as better decision for reperfusion therapy. The aim of this study is to find a correlation between the Global Registry of Acute Coronary Events (GRACE) risk score and severity of coronay artery disease assessed by Gensini score score and compare the value of GRACE and Gensini scores in predicting the long-term outcomes in patients with NSTE-ACS.
Methods: A total of 220 patients with NSTE-ACS who underwent coronary angiography were enrolled in our study. The Gensini score was used to assess the severity of coronary artery disease. According to the GRACE score, the patients were grouped into low, intermediate and high groups. After 30 months of follow-up, 20 patients died.
Results: The mean Gensini scores were 11.8 ± 11.5, 27.4 ± 30.9, and 42.9 ± 29.7 in the low, intermediate and high-risk groups, respectively. The GRACE scores and Gensini score had a moderate positive correlation (rho = 0.522, p < 0.001). The survival rates showed a less rapid deterioration from the low to high GRACE groups (P = 0.013) than when classified according to their Gensini tertiles (P = 0.02). Area under the ROC curve was statistically significant for both scores, but area of the GRACE risk score (0.71; 95% Cl = 0.60 - 0.82) was higher than that the Gensini risk score (0.66; 95% Cl = 0.53 – 0.80).
Conclusion: Our study revealed that the Gensini score had a positive and significant relationship with the GRACE score in patients with NSTE-ACS. The GRACE score had a more value in predicting long-term outcomes in patients with NSTE-ACS.
Introduction
Non-ST-elevation acute coronary syndrome (NSTE-ACS) includes unstable angina and non-ST-elevation myocardial infarction (NSTEMI). Patients with NSTE-ACS present with diverse clinical presentation and are liable to death and ischemic heart events, and different studies have shown a variety of short-term and long-term outcomes after NSTE-ACS1, 2, 3. Consequently, patients diagnosed with NSTEMI should undergo risk stratification shortly after their presentation. Several metrics for risk factors have been associated with the development of atherosclerosis and its clinical consequences (including NSTEMI). The relationship between these risk factors and in-hospital mortality has been evaluated by several previous studies. Some of the modifiable risk factors have been found to be diabetes, hypertension, smoking, body weight, cholesterol and lipid levels4, 5. Furthermore, there are some non-modifiable risk factors such as age, gender, and family history of coronary heart diseases (CHD)6, 7.
Early risk stratification provides a future prognosis for the patients’ health conditions, and helps to identify patients who are at risk for arrhythmic and non-arrhythmic death after myocardial infarction8, 9, 10. Risk stratification is done by using validated risk prediction models on an extensive database of patients with NSTEMI. Several different risk scores have been developed to assess short- and long-term outcomes after acute coronary artery diseases, based on extensive clinical trials and registries11, 12, 13, 14, 15, 16. Some examples of these risk stratification models include TIMI, PAMI, PURSUIT, and GRACE risk score models17, 18, 19, 20.
The global registry of acute coronary events (GRACE) risk score has shown superior results over other scoring systems18. The GRACE registry contains data from 11,389 patients with STEMI and NSTEMI from 94 hospitals across 14 countries to estimate the risk of in-hospital and six-month mortality rates among patients with the acute coronary syndrome (ACS) 13. Point scores were assigned for each predictive factor that accounts for the prognostic information of the risk of in-hospital mortality. A nonogram was published with the GRACE risk model to also allow for the calculation of the scores 19. The GRACE score is a model risk score consisting of 8 clinical variables 13, whereas the Gensini score is commonly used to evaluate the severity of CHD based on results of coronary angiography21. It was developed to quantify the severity of coronary artery disease (CAD). However, subsequent studies have revealed its ability to identify patients who are at high risk of occurrence of worsening long-term outcomes who are treated with percutanous coronary intervention 22. However, little is known about the association between the severity of CAD assessed by the Gensini score and long-term outcomes in patients with NSTE-ACS. Although this score provides a quantitative evaluation, it might not be feasible or appropriate for each patient to undergo angiography. In clinical practice, there is a need for an initial stratification of NSTE-ACS patients to better identify those at higher risk and decrease the incidence of major adverse cardiovascular events through more appropriate targeting of preventive measures.
The relationship between these two scores has been conducted by some studies, but there is still lack of evidence of their relationship. It remains unclear whether patients’ long-term outcomes will be better predicted by the GRACE score, which is calculated on clinical variables, or by the Gensini score, which is based on the severity of CAD. Therefore, this study aimed to evaluate the correlation between the GRACE score and severity of CAD (angiographically detected by the Gensini score), and to evaluate the predictive role of these scores to detect long-term outcomes in patients with NSTE-ACS.
Methods
Study design and population
A prospective study was performed at Cho Ray Hospital (Ho Chi Minh City, Vietnam). The study population consisted of all consecutive patients admitted to the hospital due to NSTE-ACS between October 2016 and February 2017. Inclusion criteria included: (1) NSTE-ACS that was de novo and the diagnosis based on the European Society of Cardiology Guidelines of 2015 for the management of acute coronary syndromes in patients presenting without persistent ST-segment elevation3; (2) age of 18 years or older; (3) patients undergoing emergency, urgency, or selective coronary angiogram during the hospital stay; and (4) written informed consent before enrollment in the study. Exclusion criteria included: (1) history of prior myocardial infarction; (2) previous coronary revascularization (PCI or CABG); and (3) patients who did not take a coronary angiogram in the hospital stay after their written informed consent. All of the included patients were followed up for 30 months after hospital discharge. The study endpoint was all-cause mortality. Moreover, we aimed to estimate the ability of the GRACE score to predict death throughout 30 months of follow-up, as well as the severity of coronary artery disease. Therefore, the goal was to assess the correlation between the GRACE and Gensini scores which are used to estimate the severity of atherosclerosis in the coronary arteries.
Risk score calculation
The Global Registry of Acute Coronary Events (GRACE) risk score was calculated for each patient from initial clinical characteristics, laboratory values, and ST-segment deviation on electrocardiogram (ECG) obtained on admission according to GRACE ACS Risk and Mortality Calculator (available at https://www.mdcalc.com/grace-acs-risk-mortality-calculator)13. The parameters included age, Killip class, presence of ST-segment elevation, presence of elevated serum cardiac biomarkers, serum creatinine level, systolic blood pressure, and heart rate. All collected data were entered into a computer database. All patients underwent coronary angiography during the hospital stay (either emergency, early, or selective coronary angiography). The atherosclerotic coronary burden was estimated by using Gensini score, in which the score is based on the assessment of the number of stenotic segments along with their localization in the coronary tree and respective degrees of luminal stenosis21. Two experienced cardiologists examined the Gensini score.
Statistical analysis
Data were analyzed using Stata statistics version 13 for Windows (StataCorp. 2013. Stata Statistical Software:Release 13. Collage-Station, TX: StataCorp LP). The correlation between the GRACE score and the Gensini score was examined by Spearman correlation analysis. Patients were categorized into three groups: low risk (≤ 108), intermediate risk (109 – 140), and high risk (> 140) according to their GRACE risk scores. The receiver operating characteristic (ROC) curve was computed, and the area under the curve (AUC) and its 95% confidence interval (CI) were used to predict all-cause mortality at 30 months follow-up. We used Kaplan-Meier estimator to display survival based on the GRACE score, and Gensini score and log-rank test were used to compare the significance of the GRACE score as a risk stratification model. Cox regression analysis was used to assess a hazard ratio for the cut-off point of GRACE and Gensini scores. Statistical significance was defined when the p-value was less than 0.05.
Results
Clinical characteristics

Flow chart consists of 220 patients with NSTE-ACS who underwent coronary angiogram study with follow-up.
The study population consisted of 220 patients with NSTE-ACS who underwent coronary angiogram (Figure 1). Of these 220 patients, 130 (59.1%) were male. The mean age of the study population was 65.5 ± 11.0 years. The mean GRACE score in the study was 131.7 ± 37.0, and the median Gensini score was 18 (ranging between 8 – 43). Based on the GRACE scores, patients were divided as follows: 59 (26.8%) patients in the low-risk group, 76 (34.5%) in the intermediate-risk group, and 85 (38.6%) in the high-risk group. The clinical features and laboratory tests of these groups are shown in Table 1. The mean GRACE scores were 90.0 ± 12.9, 122.5 ± 8.2 and 168.9 ± 26.4 in the low, intermediate and high-risk groups, respectively. The mean age was 55.5 ± 8.0, 65.5 ± 9.5 and 72.4 ± 8.7 in the low, intermediate and high-risk groups, respectively. The difference between the groups according to the risk factors of coronary artery disease was not significant for male sex, smoking, diabetes, serum creatinine, cholesterol and LDL-C levels. On the other hand, other factors including BMI (P = 0.001), hypertension (P = 0.004), and ejection fraction (P < 0.001) were statistically significant. Moreover, the difference of the GRACE risk scores was significant between the high- and low-risk groups.
Characteristics of patients according to the stratification risk of GRACE score
|
|
All n = 220 |
Low risk n = 59 |
Intermediate risk n = 76 |
High risk n = 85 |
P value |
|
Demographic data | |||||
|
Age, years |
65.5 ± 11.0 |
55.5 ± 8.0 |
65.5 ± 9.5 |
72.4 ± 8.7 |
<0.001 |
|
Male sex, no (%) |
130 (59.1) |
38 (64.4) |
49 (64.5) |
43 (50.6) |
0.12 |
|
BMI, Kg/m2 |
22.2 ± 3.1 |
23.3 ± 2.6 |
22.0 ± 3.5 |
21.6 ± 2.9 |
0.001* |
|
Clinical status | |||||
|
SBP, mmHg |
120.7 ± 22.1 |
129.2 ± 22.7 |
122.6 ± 17.5 |
113.1 ± 30.0 |
0.002* |
|
Heart rate, bpm |
81.5 ± 11.1 |
78.4 ± 11.0 |
80.7 ± 9.3 |
84.4 ± 12.1 |
0.004 |
|
Killip level Killip I, no (%) Killip > I, no (%) |
214 (97.3) 6 (2.7) |
59 (100) 0 (0) |
76 (100) 0 (0) |
79 (92.9) 6 (7.1) | |
|
Medical history | |||||
|
Smoking, no (%) |
101 (45.9) |
25 (42.4) |
35 (46.1) |
41 (48.2) |
0.785 |
|
Hypertension, no (%) |
189 (85.9) |
45 (76.3) |
63 (82.9) |
81 (95.3) |
0.004 |
|
Diabetes, no (%) |
51 (23.2) |
8 (13.6) |
22 (29.0) |
21 (24.7) |
0.10 |
|
Type of NSTE-ACS Unstable angina NSTEMI |
124 (56.4) 96 (43.6) |
50 (84,8) 9 (15.2) |
53 (69.7) 23 (30.3) |
21 (24.7) 64 (75.3) |
< 0.001 |
|
Laboratory tests | |||||
|
Cardiac enzyme positive, no (%) |
96 (43.6) |
9 (15.2) |
23 (30.3) |
64 (75.3) |
< 0.001 |
|
eGFR, ml/minute/1.73 m2 |
56.6 ± 11.4 |
60.4 ± 9.3 |
57.9 ± 11.6 |
52.7 ± 11.4 |
< 0.001 |
|
Serum creatinine, mg (%) |
1.25 ± 0.25 |
1.21 ± 0.15 |
1.23 ± 0.19 |
129 ± 0.33 |
0.348* |
|
Cholesterol, mg (%) |
181.5 ± 51.2 |
186.5 ± 49.1 |
174 ± 49.2 |
184 ± 49.2 |
0.344 |
|
HDL- C, mg (%) |
35.0 ± 9.5 |
35.8 ± 8.6 |
34.0 ± 10.0 |
35.5 ± 9.8 |
0.47 |
|
LDL-C, mg (%) |
113.0 ± 41.9 |
113.5 ± 38.0 |
108.5 ± 42.0 |
115.4 ± 44.5 |
0.513 |
|
Ejection Fraction (%) |
53.8 ± 12.7 |
55.9 ± 9.8 |
54.9 ± 11.0 |
48.4 ± 13.7 |
< 0.001* |
|
GRACE score |
131.7 ± 37.0 |
90.0 ± 12.9 |
122.5 ± 8.2 |
168.9 ± 26.4 |
< 0.001* |
Extent of CAD on Angiography according to the stratification risk of GRACE score
|
|
All n = 220 |
Low risk n = 59 |
Intermediate risk n = 76 |
High risk n = 85 |
P value |
|
GENSINI score |
29.2 ± 29.8 |
11.8 ± 11.5 |
27.4 ± 30.9 |
42.9 ± 29.7 |
< 0.001* |
|
One-vessel disease, no (%) |
54 (24.6) |
29 (49.17) |
20 (26.3) |
5 (5.9) |
< 0.001 |
|
Two-vessel disease, no (%) |
65 (29.6) |
14 (23.7) |
26 (34.2) |
25 (29.4) |
< 0.001 |
|
Three-vessel disease, no (%) |
85 (38.6) |
4 (6.8) |
26 (34.2) |
55 (64.7) |
< 0.001 |
|
Left main, no (%) |
23 (10.5) |
2 (3.4) |
3 (3.9) |
18 (21.2) |
P < 0.001 |

Scatter plot included fitted line and correlation between of the GRACE score and the Gensini score (Spearman's rho = 0.522, p < 0.0001).
The linear regression between GRACE and Gensini angiographic scores shows a moderate correlation between the two scores, which indicates that the GRACE score can be used to predict CAD severity, but only in the presence of other risk factors, and especially with the high-risk groups (r = 0.522, p < 0.001) (Figure 2).
Angiographic and follow-up outcomes
Clinical characteristics and coronary angiogram between the GRACE groups are shown in Table 1. According to our statistics, 124 patients had stable angina while 96 patients had NSTEMI. Furthermore,the angiographic findings are presented in Table 2. Notably, 18 out of 23 patients with LMCA disease were in the high-risk groups. LMCA was least common in the low-risk group, only affecting 2 patients. The difference between the two groups was statistically significant (P < 0.001). On the other hand, 29 out of 54 patients with one-vessel disease were in the low-risk group, while only 5 were in the high-risk group. Moreover, two-vessel and three-vessel or LMCA diseases were more common in the high-risk group, with a prevalence rate of 29.4%, 64.7% and 21.2%. The low-risk group, on the other hand, had the highest prevalence rate of one-vessel disease (49.1%). Moreover, after 30 months of follow-up, 35 patients were lost to follow-up, and 20 cases of death were reported (Figure 1).
Association between scores and outcomes

Kaplan-Meier survival curves showing the all-cause mortality of sub-groups with logrank test p = 0.013 and p = 0.02 according to their GRACE risk scores (A) and tertiles of their Gensini scores (B).
The Logrank test was used as the test of significance. The survival rates showed a less rapid deterioration from the low to high GRACE groups (P = 0.013) than when classified according to their Gensini tertiles (P = 0.02) (Figure 3). In addition, the GRACE score was more sensitive (100%) than the Gensini score (60%). Area under the ROC curve was statistically significant for both scores, but area of the GRACE risk score (0.71; 95% confidence interval = 0.60 – 0.82) was higher than that of the Gensini risk score (0.66; 95% confidence interval = 0.53 – 0.80) (Figure 4). Moreover, there was no significant difference between these scores for prediction of all-cause mortality with the DeLong test (P = 0.417) (Figure 4).
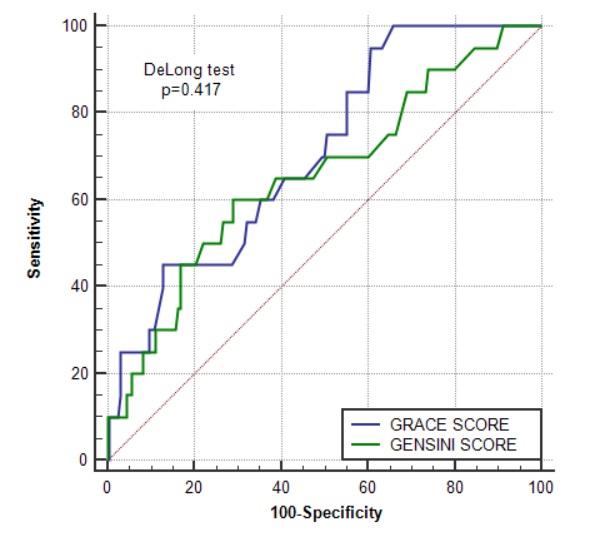
ROC curves of GRACE score (blue curve) and Gensini score (green curve) for all-cause mortality with DeLong test p-value = 0.417.
Discussion
The main finding of this study was that both scores had the ability to predict long-term outcomes; the higher the score, the higher the mortality rate. Besides, there was no significant difference between the scores in terms of prediction of long-term outcomes. Our study also demonstrated that the GRACE score was significantly valuable in the assessment of severity of coronary artery stenosis in patients with NSTE-ACS. In our study, according to the statistics that were done on patients with NSTE-ACS during their hospital stay at Cho Ray Hospital (Ho Chi Minh City, Vietnam) between October 2016 and February 2017, we found that the GRACE score was more sensitive (100%), but less specific (35%), than the Gensini score (Sensitivity = 60%, Specificity = 71%) in predicting the severity of CAD outcomes and moralities of these patients.
According to the current recommendations, the GRACE score is used commonly for risk stratification and prognosis in patients with NSTE-ACS19, 23, 24. Recently, some studies favored the Gensini score to predict mortality and morbidity in patients presenting with acute myocardial infarction 25, 26. To the best of our knowledge, there were very few studies that have compared the values of the GRACE and Gensini scores in prediction of long-term outcomes for patients with NSTE-ACS. Therefore, our study is one of the few studies that investigated the correlation between the two scores. Some studies have mentioned the correlation between the two scores to compare them with that of other scores, such as TIMI risk score27, 28 and SYNTAX risk score29; according to those studies, the GRACE score was superior to all other scores. The results of our study are consistent with those studies in that the two scores were valuable in predicting outcomes, and in that the GRACE score had a higher predictive value than the Gensini score30, 25, 29. This could be explained that when an acute event (e.g. acute coronary syndrome) occurs, the changes in hemodynamic parameters, such as blood pressure and heart rate, as well as the severity of cardiac damage (such as levels of cardiac enzymes), will reflect the severity of the disease. The changes are then related to the patient's long-term prognosis. The clinical variables are the components calculated in the GRACE score 13. Marini et al. documented that there was no significant difference in the severity of coronary artery stenosis assessed by the Gensini score in patients with stable or acute coronary syndromes31.
In this prospective study, we found a moderate correlation between the GRACE and the Gensini scores (r = 0.522, p < 0.001). However, Cakar et al., in their 2013 study, found a strong correlation between the two scores30. Moreover, our study assessed the correlation between many risk factors of the angiographic features of our patients and their GRACE scores. Among these factors, the ones which were positively correlated with the GRACE scores were male gender, smoking, diabetes, serum creatinine, HDL-C, and cholesterol (Table 1). Other studies have reported correlations with age, male sex, diabetes mellitus and smoking32, 33. Accordingly, these factors may increase the predictive ability of the score. In our study, the results indicated a positive correlation between the GRACE and the Gensini scores; increases in the scores represented severe atherosclerosis.
Furthermore, in our study, we found that one-vessel disease was more common in the low-risk group, while two-vessel disease was more common in the intermediate- and high-risk groups. Moreover, three-vessel or left main coronary artery (LMCA) diseases were more common in the high-risk group. Therefore, patients with low GRACE risk scores are more prone to have one-vessel disease, while those with intermediate- and high-risk scores are more prone to have more than one-vessel disease (2 or more), and LMCA, especially with high GRACE risk scores. Consequently, the GRACE score is able to predict the angiographic features of these patients. Cakar et al., in their 2014 study, showed that patients in the low-risk group (by GRACE score) commonly present with normal coronary arteries and stable CAD, while those in the high-risk group (by their GRACE score) usually have significant vessel injuries or main coronary vessel lesions, which are consistent findings to those in our study 30.
However, our study has some limitations. Firstly, the Gensini score was measured by visual lesion assessment (rather than laboratory determination), which would likely lead to greater interobserver variability. Secondly, the number of patients in our study was relatively small.
Conclusion
Our study revealed that the Gensini score had a positive and significant relationship with the GRACE score. Our study indicated that both the GRACE and Gensini scores are valid in predicting long-term outcomes in patients with NSTE-ACS. However, the GRACE score is more predictable than the Gensini score. Further investigations on larger populations are needed to confirm our study results.
Acknowledgments
This study was conducted at in the Cardiology Intervention Department, Cho Ray Hospital. We would like to thank the Medical staff who helped with the data collection.
Author’s contributions
Concept or design: Sy Van Hoang, Kha Nguyen Minh. Acquisition of data: Kha Minh Nguyen, An Hoang Nguyen, Hai Phuong Nguyen Tran. Analysis or interpretation of data: Sy Van Hoang, Kha Nguyen Minh,Khoa Le Anh Huynh. Drafting of the manuscript: Sy Van Hoang, Kha Nguyen Minh, Hai Phuong Nguyen Tran, Khoa Le Anh Huynh. Critical revision of the manuscript for important intellectual content: Sy Van Hoang, Kha Nguyen Minh, An Hoang Nguyen, Khoa Le Anh Huynh, Hai Phuong Nguyen Tran. All authors had full access to the data, contributed to the study, approved the final version for publication, and take responsibility for its accuracy and integrity. All authors read and approved the final manuscript.
Funding
This research received no specific grant from any funding agency in the public, commercial, or not-for-profit sectors.
Availability of data and materials
Data and materials used and/or analyzed during the current study are available from the corresponding author on reasonable request.
Ethics approval and consent to participate
The study was carried out in accordance with the Declaration of Helsinki and approved by the ethics committee in the biomedical research of the University of Medicine and Pharmacy at Ho Chi Minh City, and Cho Ray Hospital (ID: 263/DHYD-HD) on 13 September 2016. All of the included patients were asked to sign informed consents.
Consent for publication
Not applicable.
Competing interests
The authors declare that they have no competing interests.