


The Interplay of Acute-to-Chronic Glycemic Ratio with Other Biomarkers in Diabetic Foot Ulcers: An Effect is not Related to the Therapeutic Remedies
- Department of Clinical Pharmacy, College of Pharmacy, University of Sulaimani, 46001 Sulaymaniyah, Iraq
- Department of Clinical Pharmacology and Therapeutics, College of Medicine, University of Diyala, 32001 Baqubah, Iraq
Abstract
Introduction: Diabetic foot ulcers (DFUs) primarily develop from peripheral arterial ischemia and peripheral neuropathy, are often complicated by infections, and lead to lower-extremity amputation. Uncontrolled glycemic status and high glycosylated hemoglobin (HbA1c) levels are associated with DFUs. This study aimed to evaluate the acute-to-chronic glycemic ratio in patients with type 2 diabetes (T2D) and DFUs and compare it with those without DFUs, while considering its relationships with other indices reflecting T2D pathogenesis.
Methods: This cross-sectional study was conducted on T2D patients with DFUs (Group I, n = 44) and those without DFUs (Group II, n = 46). The primary outcome was to determine the acute-to-chronic glycemic ratio (ACGR), while secondary outcomes included anthropometric, metabolic, and hematological variables.
Results: Group I patients had significantly higher median values of ACGR (1.04 vs. 0.087), leukocyte-to-glucose index (1.775 vs. 1.316), arterial stiffness (0.404 vs. 0.380), and triglyceride-glucose-conicity index (13.3 vs. 12.8) compared to Group II. No significant differences were observed in these markers between patients treated with oral hypoglycemic agents and those receiving insulin therapy. A significantly higher ACGR area under the curve (AUC=0.647, 95% C.I=0.531-0.762, p = 0.017) was noted in Group I, with a sensitivity and specificity of 59.1% and 62.5%, respectively.
Conclusions: The acute-to-chronic glucose ratio emerged as a significant biomarker for diabetic foot ulcers, demonstrating relationships with other related biomarkers. The moderately limited sample size underscores the preliminary nature of these findings. This study was registered on ClinicalTrial.gov (NCT 06725238).
Introduction
Diabetic foot ulcers (DFUs) are a microvascular complication of diabetes mellitus that affect approximately 18.6 million people worldwide each year1. Peripheral neuropathy and peripheral vascular ischemia, which are associated with DM and often complicated by infection, are among the major risk factors for DFUs2. One of the key strategies for managing DFUs is strict glucose control since elevated blood glucose levels are strongly implicated in the development of peripheral arterial disease and neuropathies3. Patients with DFUs and peripheral arterial disease have significantly higher glycosylated hemoglobin (HbA1c) levels than those without peripheral ischemia, underlining their role as a risk factor4.
Therefore, the glycemic index reflects the acute (current) level of fasting plasma glucose, while HbA1c depicts chronic glycemic status—both are often elevated in DFUs. Chronic plasma glucose levels can be calculated using the formula 28.7 × HbA1c (%) – 46.75. Therefore, the acute and chronic glycemic statuses can be combined into the acute-to-chronic glycemic ratio (ACGR), which could serve as a risk factor or prognostic marker in DFUs6. This ratio is also known as the stress hyperglycemic ratio in non-diabetic patients admitted to the hospital with critical illnesses and a fasting plasma glucose exceeding 180 mg/dL7, 8, 9.
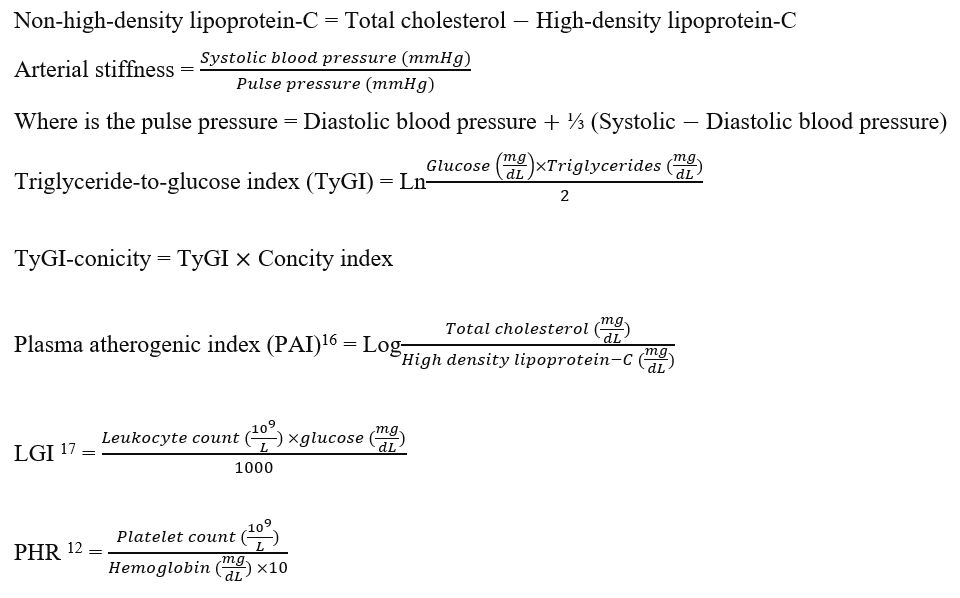
Ulcer infection is commonly associated with elevated total leukocyte counts and inflammatory markers (e.g., C-reactive protein and erythrocyte sedimentation rate)10, 11. The leukocyte-glucose index (LGI), which integrates total leukocyte counts and plasma glucose levels, may function as a prognostic biomarker in DFUs. In addition, the platelet-to-hemoglobin ratio (PHR) is a cardiovascular biomarker related to myocardial ischemia and could also serve as a prognostic biomarker in DFUs12, 13.
DFU patients frequently experience microbial infection and poorly controlled glycemic levels14, 15, placing them at elevated risk for limb amputation or death. As such, measuring the ACGR could help address gaps in DFU research by identifying this ratio as a discriminatory marker and relating it to the above-mentioned biomarkers. This study aims to evaluate the ACGR in type 2 diabetes mellitus (T2D) patients with DFUs and compare it with those without DFUs. We also examine markers related to DFU pathogenesis, including indices and ratios drawn from vascular, metabolic, and hematological determinants, along with the impact of insulin therapy on glycemic control.
Methods
Study Design
This cross-sectional study was conducted at the Department of Clinical Pharmacy, College of Pharmacy, University of Sulaimani, in cooperation with Shar Hospital from June 1, 2023, to June 1, 2024. This study was carried out in Sulaymaniyah province, and all subjects were of Kurdish ethnicity. This study was approved by the Institutional Ethical Review Committee of the College of Pharmacy at the University of Sulaimani (Date: PH130-24, dated September 9, 2024) and registered on ClinicalTrials.gov (NCT 06725238). All participants were informed about the aims and design of the study, and informed consent clarified that participants underwent laboratory investigations with no interference in their current management.
Data Collection
Participants who were referred to the consultant clinics at Shar Hospital were included if they had (i) a history of T2D regardless of antidiabetic medication use (including metformin alone or combined with sitagliptin, dapagliflozin, or glipizide); (ii) clinical and laboratory evidence of diabetic foot ulcers. Participants were excluded if they had (i) a history of recent systemic infections (excluding non-DFU infections)—for example, respiratory tract or urinary tract infections—within four weeks; (ii) significant alcohol consumption; (iii) surgical procedures within four weeks; (iv) pregnant or breastfeeding women; and (v) terminal illnesses. In total, 90 patients with complete clinical and laboratory data were included for analysis. The participants were grouped into:
Group I (n = 44): patients with DFUs
Group II (n = 46): patients who had T2D without DFUs
The demographic data, including age, sex, duration of diabetes, antidiabetic medication, and history of amputation, were obtained. The anthropometric parameters, including weight (kg), height (m), and waist circumference (cm), were measured.
Definition of Pathological Conditions
DFUs are a macrovascular complication of diabetes mellitus resulting from peripheral artery disease and peripheral neuropathy that commonly affects the lower extremities. DFUs are usually classified and scored according to clinical findings. The acute-to-chronic glycemic ratio is computed by dividing the acute (or current, or on admission) plasma glucose level by the chronic plasma glucose level calculated using the current (or on admission) HbA1c value.
Blood Biochemistry Examination
All the biochemical assessments were performed in the laboratory of the Shar Hospital. Fasting blood samples were collected from participants who had fasted overnight, and serum or plasma samples were analyzed on the same day. The anticoagulant EDTA whole blood was used for hematological parameters. The biochemistry measurements included fasting plasma glucose (acute or current); glycosylated hemoglobin; lipid profiles (serum cholesterol, triglycerides, and high-density lipoprotein-C); and hematological indices (hemoglobin; leukocyte count, platelet count).
Calculating the anthropometric and biochemical indices16, 17
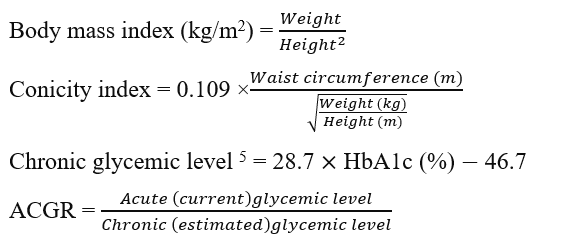
This index is used instead of the conicity index-body mass index or conicity index-waist circumference, as it represents the combination of height, weight, and waist circumference.
Statistical analysis
Statistical analyses were carried out using SPSS 25 (IBM Corp., Armonk, NY, USA). The sample size was calculated by using the Gpower software version 3.1, which adjusted the margin of error (α error = 0.05, β = 0.2, the power is 0.8), two tails, and a 95% confidence interval. This software is compatible with Windows, and it is available online. The Shapiro-Wilk test was used to evaluate the normality assumption of quantitative variables. Categorized and continuous data are presented as numbers (percentages) and medians (inter-quartiles; Q1, Q3), respectively. For comparing baseline characteristics between groups, the non-parametric tests for non-normal data (Mann-Whitney U test) were used for continuous data, while the chi-squared test analyzed the categorical data. A Cohen's d test was carried out to show the adequacy of the sample size by comparing the means and standard deviations of Groups I and II. The multivariate regression analysis test (including the tolerance and variance inflation factor estimates) was performed to predict the ACGR (as a dependent variable) and the other biomarker ratios as independent predicted variables. A bootstrap analysis was done to show the effect of some biomarkers as independent variables on the ACGR. A matrix correlation (Spearman’s) was used to show the inter-relationship between the biomarkers. The area under the curve (AUC) and 95% confidence interval of the ACGR at a cutoff value of 1.0 was calculated to discriminate Group I from Group II and the patients treated with insulin from those treated with OHS in Group I. The sensitivity and the specificity for ACGR were calculated. P-values are unadjusted for multiple testing, and the findings were interpreted as exploratory. A p-value of < 0.05 was considered statistically significant.
Characteristics of the participants
|
Variables |
Group I (n = 44) DFUs (n = 44) |
Group II (n = 46) Non-DFUs (n = 46) |
p-value |
|---|---|---|---|
|
Age, y |
56.5 (50.3, 63.0) |
52.0 (45.0, 60.0) |
0.034 |
|
Sex |
|
|
0.257 |
|
Male |
14 |
20 | |
|
Female |
30 |
26 | |
|
Duration, y |
9.5 (6.0, 13.8) |
5.0 (4.0, 10.0) |
0.003 |
|
Medications, No. |
|
|
<0.001 |
|
Oral hypoglycemic agents |
17 |
35 | |
|
Insulin |
27 |
11 | |
|
History of amputation |
7 |
0 |
NC |
|
Anthropometric determinants | |||
|
Body mass index, kg/m2 |
29.2 (24.7, 33.1) |
28.2 (25.7, 30.2) |
0.645 |
|
Conicity index, cm/cm-2.kg-2 |
1.35 (1.31, 1.39) |
1.31 (1.25, 1.35) |
0.006 |
|
Glycemic profile | |||
|
Current (acute) plasma glucose, mg/dL |
233 (191, 279) |
185 (138, 254) |
0.025 |
|
Estimated (chronic) plasma glucose, mg/dL |
222 (180, 260) |
209 (188, 246.8) |
0.503 |
|
HbA1c, (%) |
9.35 (7.90, 10.68) |
8.90 (8.18, 10.23) |
0.503 |
|
Acute-to-chronic glycemic ratio |
1.04 (0.855, 1.198) |
0.87 (0.692, 1.106) |
0.017 |
|
Lipid profiles, mg/dL | |||
|
Cholesterol |
169.0 (135.3, 197.8) |
173.0 (149.8, 205.5) |
0.608 |
|
Triglyceride |
154.0 (108.5, 235.8) |
163.5 (93.3, 244.8) |
0.994 |
|
High-density lipoprotein-C |
40.0 (34.0, 47.0) |
38.0 (32.0, 44.3) |
0.555 |
|
Non-high-density lipoprotein-C |
127.5 (100.3, 156.5) |
133.0 (105.3, 178.8) |
0.524 |
|
Hematological indices | |||
|
Hemoglobin, g/dL |
13.1 (12.1, 14.1) |
14.0 (12.7, 15.0) |
0.020 |
|
Leukocyte count, No. (103/mm3) |
7.75 (6.375,9.350) |
6.7 (5.775, 8.250) |
0.025 |
|
Platelet count, No. (109/mm3) |
234.5 (200.5, 264.5) |
221.5 (186.75, 262.5) |
0.370 |
Results
Baseline Data
Table 1 indicates that the median age, duration of diabetes, and proportion of patients receiving insulin therapy were significantly higher in Group I than in Group II. A significantly higher median conicity index was noted in Group I compared with Group II, while the median BMI did not significantly differ between the two groups. The median levels of the lipid profiles—including cholesterol, triglycerides, high-density lipoprotein, and non-high-density lipoprotein-cholesterol—did not differ significantly between Groups I and II. Although hemoglobin levels and leukocyte counts remained within normal ranges, they differed significantly between Groups I and II, with lower hemoglobin and higher leukocyte counts in Group I compared with Group II. Current glycemic indexes demonstrated significantly higher median (acute) glucose values and acute-to-chronic glycemic ratios in patients with DFUs than in those without DFUs (233 vs. 185 mg/dL, p = 0.025, and 1.04 vs. 0.87, p = 0.017, respectively) (Table 2 ). Patients with DFUs also had significantly higher median LGI, TyGI-conicity index, and arterial stiffness index values than their counterparts in Group II (Table 2).
The results of the biomarkers as median (interquartile range) and mean ± SD
|
Biomarkers |
Group I (n = 44) |
Group II (n = 46) |
p-value |
Group I (n = 44) |
Group II (n = 46) |
p-value |
d-value |
|
Median (interquartile range) |
Median (interquartile range) |
Mean ± SD |
Mean ± SD | ||||
|
Leukocyte glucose index |
1.775 (1.265, 2.349) |
1.316 (0.938, 1.641) |
0.004 |
1.86±0.78 |
1.45±0.76 |
0.013 |
0.371 |
|
Plasma atherogenic index |
0.624 (0.556, 0.734) |
0.628 (0.413, 0.838) |
0.904 |
0.63±0.15 |
0.63±0.36 |
1.000 |
0.000 |
|
Triglyceride glucose index |
9.841 (9.287, 10.352) |
9.859 (9.125, 10.170) |
0.488 |
9.78±0.74 |
9.72±0.73 |
0.700 |
0.057 |
|
Triglyceride glucose index-conicity |
13.289 (12.284, 14.298) |
12.781 (11.737, 13.538) |
0.039 |
13.16±1.3 |
12.66±1.16 |
0.057 |
0.272 |
|
Arterial stiffness |
0.404 (0.361, 0.464) |
0.380 (0.308, 0.420) |
0.022 |
0.41±0.07 |
0.36±0.07 |
0.001 |
0.505 |
|
Platelet-to-hemoglobin ratio |
1.781 (1.515, 2.018) |
1.658 (1.322, 1.934) |
0.178 |
1.89±0.68 |
1.72±0.63 |
0.257 |
0.177 |
|
Acute-to-chronic glucose ratio |
1.04 (0.855, 1.198) |
0.87 (0.692, 1.106) |
0.017 |
1.08±0.34 |
0.95±0.35 |
0.078 |
0.270 |
Comparison between patients managed with oral antidiabetic agents and insulin in the biomarker levels
|
Biomarkers |
Group I (n = 44) |
Group II (n = 46) | ||||
|
OHA (n = 17) |
Insulin (n = 27) |
p-value |
OHA (n = 35) |
Insulin (n = 11) |
p-value | |
|
TyGI |
10.00 (9.171, 10.370) |
9.777 (9.314, 10.356) |
0.857 |
9.885 (9.313, 10.155) |
9.648 (9.028, 10.607) |
0.879 |
|
TyGI-conicity |
13.078 (12.302, 14.266) |
13.359 (12.195, 14.301) |
0.933 |
12.779 (11.784, 13.418) |
12.783 (11.373, 14.372) |
0.648 |
|
PAI |
0.583 (0.547, 0.696) |
0.407 (0.364, 0.467) |
0.596 |
0636 (0.351, 0.830) |
0.584 (0.418, 0.863) |
0.745 |
|
Arterial stiffness |
0.364 (0.360, 0.437) |
0.632 (0.554, 0.746) |
0.205 |
0.364 (0.292, 0.417) |
0.385 (0.360, 0.424) |
0.333 |
|
ACGR |
1.031 (0.839, 1.209) |
1.084 (0.872, 1.198) |
0.933 |
0.819 (0.694, 1.066) |
0.929 (0.681, 1.287) |
0.509 |
|
LGI |
1.551 (1.269, 2.429) |
1.882 (1.250, 2.350) |
0.691 |
1.168 (0.881, 1.558) |
1.638 (1.172, 1.879) |
0.067 |
|
PHR |
1.827 (1.388, 2.079) |
1.774 (1.581, 2.019) |
0.990 |
1.529 (1.250, 1.874) |
1.835 (1.669, 2.339) |
0.036 |
Effects of therapeutic modalities on the biomarkers
In Group I, there were no statistically significant differences in biomarker levels between patients treated with oral antidiabetics and those receiving insulin (Table 3 ). Patients on insulin therapy exhibited higher median values for TyGI-conicity, arterial stiffness, ACGR, and LGI, although these differences were not statistically significant.
In Group II, a significantly higher median PHR level was found in patients receiving insulin therapy, whereas the remaining biomarkers did not demonstrate any significant differences.
The β-coefficient and confidence interval of the risk factors that predict the acute-to-chronic glycemic ratio
|
Predictors |
B-coefficient (95% CI) |
p-value |
VIF |
Tolerance |
Bias ± SE |
p-value |
|
Chronic plasma glucose |
-0.003 (-0.005, -0.002) |
<0.001 |
1.453 |
0.688 |
0.0±0.001 |
0.022 |
|
Leukocyte glucose index |
0.248 (0.089, 0.407) |
0.003 |
2.912 |
0.343 |
-0.017±0.105 |
0.044 |
|
Plasma atherogenic index |
-0.290 (-1.176, 0.597) |
0.512 |
3.410 |
0.293 |
-0.120±0.394 |
0.467 |
|
Arterial stiffness |
-0.308 (-1.460, 0.843) |
0.591 |
1.181 |
0.847 |
-0.16±0.588 |
0.667 |
|
Non-high-density lipoprotein-C |
0.000 (-0.003, 0.002) |
0.718 |
3.078 |
0.325 |
0.0±0.002 |
0.778 |
|
Triglyceride glucose index |
0.193 (0.017, 0.369) |
0.032 |
3.222 |
0.310 |
0.016±0.088 |
0.067 |
|
Conicity index |
-0.258 (-1.182, 0.666) |
0.574 |
1.074 |
0.931 |
0.052±0.409 |
0.556 |
Assessment of the acute-to-chronic glycemic ratio in diabetic foot ulcers
Table 4 presents the results of the sensitivity and robustness analyses of the independent biomarkers influencing the results of ACGR. From these data, the CPG and LGI emerged as key independent variables associated with DFUs. The results of the data bootstrapping showed negligible bias values, and the β-coefficient, tolerance, VIF, and probability for CPG were -0.003, 0.716, 1.397, p < 0.001; whereas for LGI, these values were 0.263, 0.369, 2.701, p=0.001, respectively.
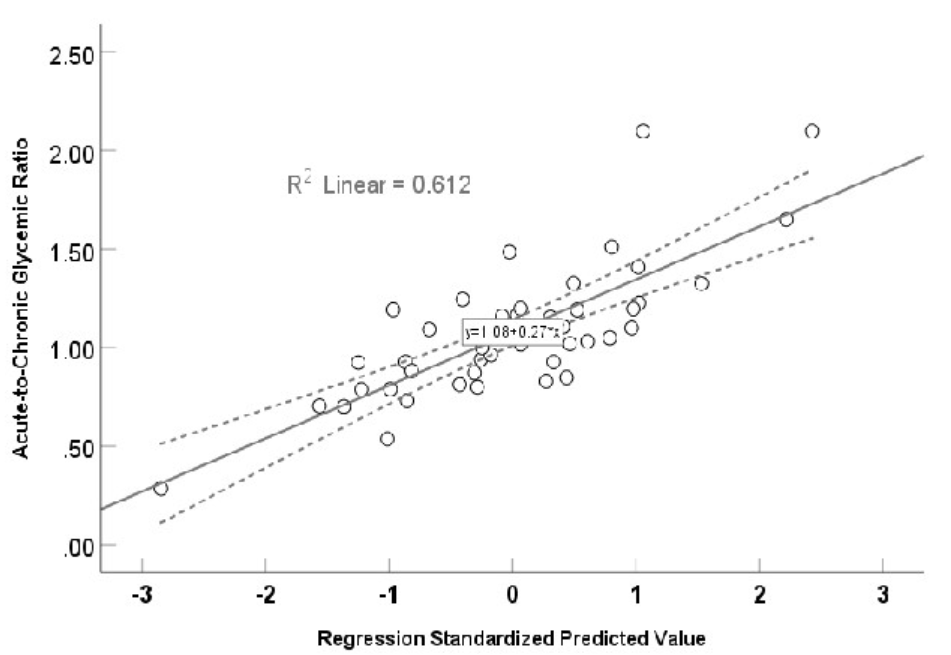
A significant (r = 0.782, F = 8.114, p <0.001) multivariate linear regression curve using stress hyperglycemia ratio as dependent variable and other biomarkers as independent variables.
Figure 3 illustrates the results of a multivariate regression analysis with β-coefficients (95% confidence intervals for each factor, which displayed a normal distribution), using a conicity index, TyGI, PAI, non-high-density lipoprotein, arterial stiffness, chronic glycemia, and LGI as associated risk factors for ACGR. A significantly positive multivariate linear regression was found between ACGR and these factors (r = 0.782, F = 8.114, p < 0.001), explaining 61.2% (R = 0.612) of the variance. The calculated prediction equation for ACGR was 1.08 + 0.27 × the value of the independent risk factor.
After reducing the predictors to CPG, LGI, and TyGI, the model R was 0.579, with β-coefficient, tolerance, VIF, and probability for CPG listed as -0.003, 0.716, 1.397, p < 0.001; for LGI listed as 0.263, 0.369, 2.701, p = 0.001; and for TyGI 0.127, 0.465, 2.150, and p = 0.076, respectively.
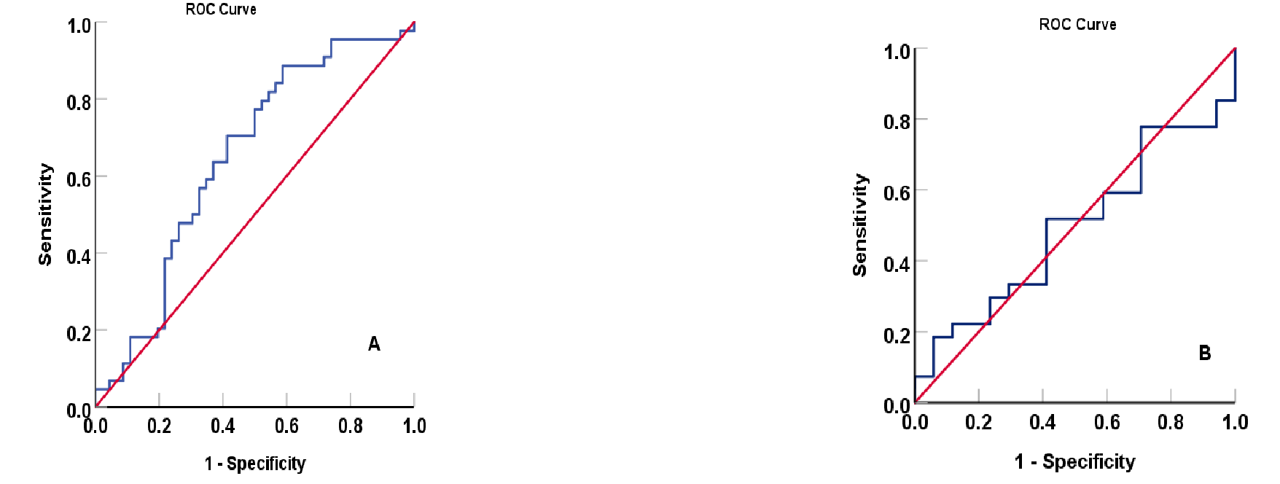
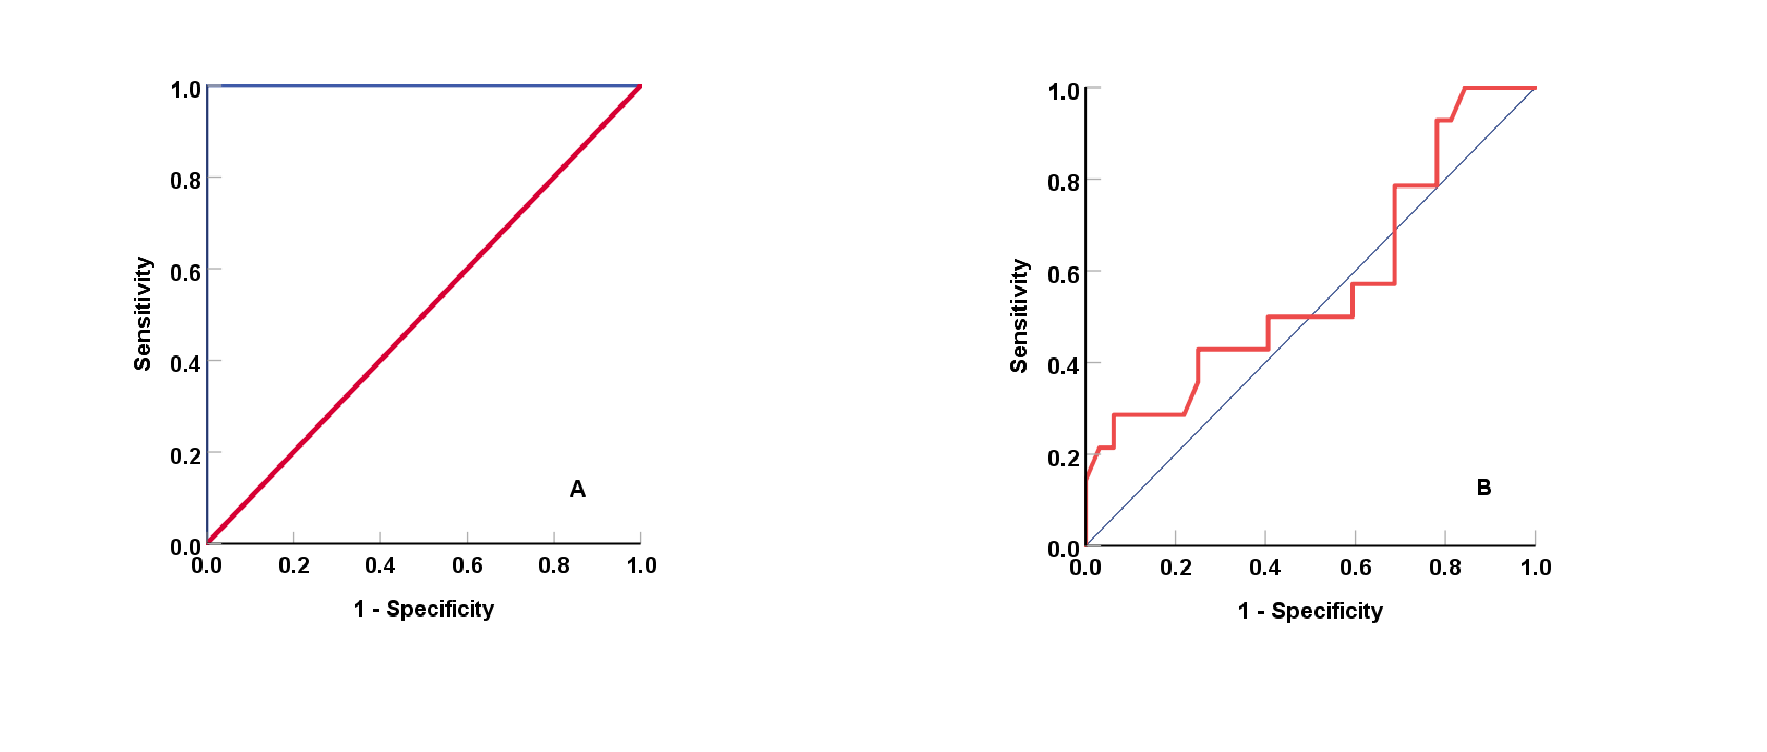
The area under the curve of acute-to-chronic glycemic ratio as a biomarker at a cutoff value of 1.00 for diabetic foot ulcers. (A) AUC: 0.647; 95% confidence interval: 0.531, 0.762, p-value: 0.017 with sensitivity of 59.1% and specificity of 62.5%, and as a discriminator between patients who were managed with insulin versus oral hypoglycemic agents in diabetic foot ulcer patients; (B) (AUC: 0.492; 95% confidence interval: 0.320, 0.665, and p-value: 0.933 with sensitivity of 58.8% and specificity of 40.7%.
Acute-to-chronic glycemic ratio (ACGR) as a discriminant biomarker
The ACGR is a strongly associated biomarker of DFU. Figure 4A shows the area under the curve (AUC) of ACGR in DFU patients is 1.000 at a cutoff value of 1.000, with sensitivity and specificity of 59.1% and 62.5%, respectively. Conversely, the ACGR biomarker is a non-significant marker in distinguishing non-DFU patients using insulin from those using oral antidiabetics (Figure 4B), with a sensitivity and specificity of 58.8% and 40.7%, respectively. Figure 5A shows that the area under the curve (AUC) of HbA1c is 1.00 at a cutoff value of 8.5% (p < 0.001). The result obtained with HbA1c is comparable to ACGR when differentiating non-DFU patients using insulin and those using oral antidiabetics, with an area under the curve of 0.570 (CI: 0.380–0.780) and a sensitivity and specificity of 36.6% and 45.7%, respectively (Figure 5B). The matrix correlations reveal significant associations between ACGR and LGI (r = 0.507, p < 0.001) and TyGI (r = 0.592, p < 0.001). Additionally, LGI is correlated with CPG (r = 0.499, p = 0.001) and TyGI (r = 0.699, p < 0.001), while PAI correlates with non-HDL-C (r = 0.691, p < 0.001) and TyGI (r = 0.605, p < 0.001).
The area under the curve of glycosylated hemoglobin as a biomarker at a cutoff value of 8.5% for diabetic foot ulcers; (A) AUC: 1.000; 95% confidence interval: 1.000, 1.000, p-value: < 0.001 with a sensitivity of 72.7% and specificity of 43.5%, and as a discriminator between patients who were managed with insulin versus oral hypoglycemic agents in diabetic foot ulcer patients; (B) (AUC: 0.570; 95% confidence interval: 0.380, 0.780, and p-value: 0.452 with a sensitivity of 63.6% and specificity of 45.7%.
Discussion
The acute-chronic glycemic ratio (ACGR) is significantly higher in Group I, and the type of antidiabetic therapy does not influence this ratio. In addition, it is significantly correlated with LGI, TyGI, and chronic glycemic status. Baseline data highlighted the characteristics of patients with DFUs and their related risk factors, which aligned with earlier research stating that DFU patients are older and have a longer duration of illness than those without DFUs18 A higher number of patients in Group I relied on insulin therapy to regulate their elevated plasma glucose levels. Therefore, shifting from oral antidiabetics to insulin therapy is advised for patients with DFUs. A significantly higher conicity index value in Group I reflects the inclusion of waist circumference as a marker of central obesity, alongside height and body weight in BMI calculations19. A significantly higher acute plasma glucose level in Group I drives the elevated ACGR and indicates that DFU is associated with poor glycemic control. No significant differences in lipid profiles were found between Groups I and II, suggesting these factors lack a direct role in the pathophysiology of DFUs. This observation aligns with a recent study that reported a paradox in the lipid profile among patients with infected DFUs20. There were no significant differences between Groups I and II, which can be attributed to intensive pharmacotherapy aimed at managing elevated blood glucose and lipid profiles, since the latter is a known risk factor for the development of DFUs. In addition, it was reported that infected DFU patients exhibited significantly lower lipid profiles, reinforcing the paradoxical role of lipids in DFU pathophysiology20. The “lipid paradox” as a cardiovascular risk factor has been demonstrated in diabetes, associated with endothelial dysfunction, genetic factors, inflammation, and malnutrition21, 22, 23. Some authors have suggested that the mechanism behind the lipid paradox involves impaired β-cell function, abnormal calcium signaling in β-cells, and downregulation of GLUT4 in adipocytes, etc.24, 25.
The hematological indices revealed the typical hallmarks of DFUs, including significantly lower hemoglobin levels and higher total leukocyte counts. Among the biomarkers examined in this study, only LGI, the TyGI–conicity index, arterial stiffness, and ACGR were significantly higher in Group I than in Group II. This finding indicates that combining multiple biomarkers, rather than relying on individual ones, significantly enhances the ability to discriminate DFUs. However, a review of the literature indicates that no studies have yet addressed these important biomarkers in DFUs.
Table 2 shows that 61.4% of Group I and 23.9% of Group II used insulin therapy as a promising means of controlling glycemic levels. In both groups, insulin therapy did not significantly affect the median values, except that the PHR was notably greater among patients receiving insulin therapy than among those on oral hypoglycemic agents in Group II. Previous research has shown that insulin therapy influences platelet function rather than platelet count, a process affected by various factors such as insulin resistance and glycemic control26. Meanwhile, newer hypoglycemic agents significantly and indirectly affect platelet indices, leading to a beneficial antithrombotic outcome27.
A plausible explanation for the discrepancy in PHR values between both groups is the limited sample size in those treated with insulin therapy. Multivariate linear regression analysis (Figure 3) revealed significant correlations between ACGR and the assessed indices. Chronic (or estimated) plasma glucose levels, TyGI, and LGI were strongly associated with ACGR. To address possible overfitting (R² = 0.612), the predictors were reduced to CPG, LGI, and TyGI, yielding an R² of 0.579. This finding suggests that the limited sample size played a role.
These findings are consistent with other studies that found relationships between HbA1c (an indicator reflecting chronic glycemic status) and DFUs28, 29. A recent study demonstrates a significantly lower value of TyGI in patients with DFUs compared with non-DFUs, in contrast to our findings, which showed a non-significant difference in TyGI between DFUs and non-DFUs30. Conversely, another study reported that patients with coronary artery disease who had a lower HbA1c and fasting plasma glucose exhibited a higher TyGI31. Hence, this difference could be attributed to limited sample size, patient ethnicity, and various precipitating factors for DFUs.
This study introduces a new indicator (LGI) derived from ACGR, which was not previously reported in the literature. Therefore, combining ACGR and LGI could significantly enhance the prediction of DFUs in the diabetic population. Matrix correlation analysis revealed significant associations among variables that incorporate glucose (e.g., TyGI, CPG, ACGR, and LGI). Meanwhile, PAI was significantly correlated with non-HDL-C or TyGI because lipid components are a part of these indices. This finding suggests no notable interaction among these variables.
Future studies with larger sample sizes, more nuanced DFU categorization, and adjusted glucose levels at DFU onset may improve sensitivity. Notably, the estimated AUCs for ACGR and HbA1c were comparable, indicating both markers are useful for assessing diabetic control. Clinically, ACGR reflects uncontrolled diabetes and may serve as a risk factor for complications such as DFUs. Because ACGR is a ratio that captures acute hyperglycemia, a value >1.0 may prompt stricter glycemic monitoring due to its association with poor prognosis32.
Cohen’s test revealed small-to-medium effect sizes (d-values ranging from 0.000 for PAI to 0.505 for arterial stiffness), indicating that sample size partly influenced these findings. Hence, our study may be underpowered for detecting subtle associations, supporting its preliminary nature. Study limitations include the small sample size, details of oral antidiabetics, and variable medication regimens. Common confounders in diabetic patients likely impacted these results, including patient age, diabetes duration, glycemic control status, DFU severity, the variable impact of oral antidiabetics, and medication adherence.
Conclusions
In patients with diabetic foot ulcers, the acute-to-chronic glycemic ratio is significantly higher than in those with non-diabetic foot ulcers. The triglyceride-glucose index, leukocyte glucose index, and long-term glycemic status are key indicators of the acute-to-chronic glycemic ratio, which remains unaffected by pharmacotherapeutic categories.
Abbreviations
ACGR: Acute-to-chronic glycemic ratio, CPG: Chronic plasma glucose, AUC: Area under the curve, DFU: Diabetic foot ulcer, HbA1c: Glycosylated hemoglobin, HDL-C: High density lipoprotein-Cholesterol, LGI: leukocyte glycemic index, PHR: Platelet-to-hemoglobin ratio, T2D: type 2 diabetes, TYGI: triglyceride-to-glucose index
Acknowledgments
The authors appreciate the assistance of the medical staff in the Shar Hospital in Sulaymaniyah, Iraq.
Author’s contributions
All authors equally contributed to this work, read and approved the final manuscript.
Funding
None.
Availability of data and materials
Data and materials used and/or analyzed during the current study are available from the corresponding author on reasonable request.
Ethics approval and consent to participate
This study was approved by the Institutional Ethical Review Committee of the College of Pharmacy at the University of Sulaimani (Date: PH130-24, dated September 9, 2024).
Consent for publication
Not applicable.
Declaration of generative AI and AI-assisted technologies in the writing process
The authors declare that they have not used generative AI (a type of artificial intelligence technology that can produce various types of content including text, imagery, audio and synthetic data. Examples include ChatGPT, NovelAI, Jasper AI, Rytr AI, DALL-E, etc.) and AI-assisted technologies in the writing process before submission.
Competing interests
The authors declare that they have no competing interests.